Experian 2016 Annual Report Download - page 167
Download and view the complete annual report
Please find page 167 of the 2016 Experian annual report below. You can navigate through the pages in the report by either clicking on the pages listed below, or by using the keyword search tool below to find specific information within the annual report.-
 1
1 -
2
-
3
-
4
-
5
-
6
-
7
-
8
-
9
-
10
-
11
-
12
-
13
-
14
-
15
-
16
-
17
-
18
-
19
-
20
-
21
-
22
-
23
-
24
-
25
-
26
-
27
-
28
-
29
-
30
-
31
-
32
-
33
-
34
-
35
-
36
-
37
-
38
-
39
-
40
-
41
-
42
-
43
-
44
-
45
-
46
-
47
-
48
-
49
-
50
-
51
-
52
-
53
-
54
-
55
-
56
-
57
-
58
-
59
-
60
-
61
-
62
-
63
-
64
-
65
-
66
-
67
-
68
-
69
-
70
-
71
-
72
-
73
-
74
-
75
-
76
-
77
-
78
-
79
-
80
-
81
-
82
-
83
-
84
-
85
-
86
-
87
-
88
-
89
-
90
-
91
-
92
-
93
-
94
-
95
-
96
-
97
-
98
-
99
-
100
-
101
-
102
-
103
-
104
-
105
-
106
-
107
-
108
-
109
-
110
-
111
-
112
-
113
-
114
-
115
-
116
-
117
-
118
-
119
-
120
-
121
-
122
-
123
-
124
-
125
-
126
-
127
-
128
-
129
-
130
-
131
-
132
-
133
-
134
-
135
-
136
-
137
-
138
-
139
-
140
-
141
-
142
-
143
-
144
-
145
-
146
-
147
-
148
-
149
-
150
-
151
-
152
-
153
-
154
-
155
-
156
-
 157
157 -
 158
158 -
 159
159 -
 160
160 -
 161
161 -
 162
162 -
 163
163 -
 164
164 -
 165
165 -
 166
166 -
 167
167 -
 168
168 -
 169
169 -
 170
170 -
 171
171 -
 172
172 -
 173
173 -
 174
174 -
 175
175 -
 176
176 -
 177
177 -
178
-
179
-
180
-
181
-
182
-
183
-
184
-
185
-
186
-
187
-
188
 |
 |

165•Notes to the Group nancial statementsFinancial statements
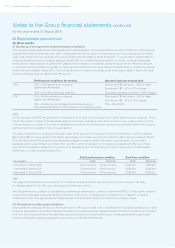
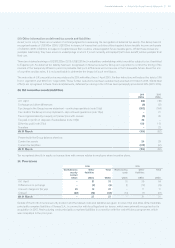
(iii) Movements in own shares held and own shares reserve
Number of own shares held Cost of own shares held
Treasury
million
Trusts
million
Total
million
Treasury
US$m
Trusts
US$m
Total
US$m
At 1 April 2015 46 13 59 692 213 905
Purchase of shares held as treasury shares 19 – 19 344 – 344
Purchase of shares by employee trusts – 4 4 – 71 71
Exercise of share options and awards (2) (3) (5) (28) (52) (80)
At 31 March 2016 63 14 77 1,008 232 1,240
Number of own shares held Cost of own shares held
Treasury
million
Trusts
million
Total
million
Treasury
US$m
Trusts
US$m
Total
US$m
At 1 April 2014 38 16 54 556 253 809
Purchase of shares held as treasury shares 10 – 10 170 – 170
Purchase of shares by employee trusts – 2 2 – 38 38
Exercise of share options and awards (2) (5) (7) (34) (78) (112)
At 31 March 2015 46 13 59 692 213 905
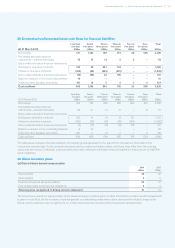
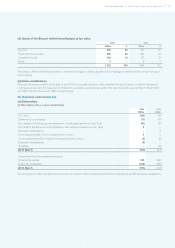
37. Notes to the Group cash flow statement
(a) Cash generated from operations
2016
US$m
2015
US$m
Profit before tax 1,027 1,006
Share of post-tax profit of associates (4) (5)
Net finance costs 95 156
Operating profit 1,118 1,157
Loss on disposals of fixed assets 1 2
(Profit)/loss on disposal of businesses (note 13(b)) (57) 2
Depreciation and amortisation (note 11) 472 518
Charge in respect of share incentive plans 54 47
Increase in working capital (note 37(b)) (21) (1)
Acquisition expenses – difference between income statement charge and amount paid 1 –
Adjustment to the fair value of contingent consideration 2 7
Working capital movement in respect of restructuring programme –(12)
Cash generated from operations 1,570 1,720