Experian 2016 Annual Report Download - page 161
Download and view the complete annual report
Please find page 161 of the 2016 Experian annual report below. You can navigate through the pages in the report by either clicking on the pages listed below, or by using the keyword search tool below to find specific information within the annual report.-
 1
1 -
2
-
3
-
4
-
5
-
6
-
7
-
8
-
9
-
10
-
11
-
12
-
13
-
14
-
15
-
16
-
17
-
18
-
19
-
20
-
21
-
22
-
23
-
24
-
25
-
26
-
27
-
28
-
29
-
30
-
31
-
32
-
33
-
34
-
35
-
36
-
37
-
38
-
39
-
40
-
41
-
42
-
43
-
44
-
45
-
46
-
47
-
48
-
49
-
50
-
51
-
52
-
53
-
54
-
55
-
56
-
57
-
58
-
59
-
60
-
61
-
62
-
63
-
64
-
65
-
66
-
67
-
68
-
69
-
70
-
71
-
72
-
73
-
74
-
75
-
76
-
77
-
78
-
79
-
80
-
81
-
82
-
83
-
84
-
85
-
86
-
87
-
88
-
89
-
90
-
91
-
92
-
93
-
94
-
95
-
96
-
97
-
98
-
99
-
100
-
101
-
102
-
103
-
104
-
105
-
106
-
107
-
108
-
109
-
110
-
111
-
112
-
113
-
114
-
115
-
116
-
117
-
118
-
119
-
120
-
121
-
122
-
123
-
124
-
125
-
126
-
127
-
128
-
129
-
130
-
131
-
132
-
133
-
134
-
135
-
136
-
137
-
138
-
139
-
140
-
141
-
142
-
143
-
144
-
145
-
146
-
147
-
148
-
149
-
150
-
 151
151 -
 152
152 -
 153
153 -
 154
154 -
 155
155 -
 156
156 -
 157
157 -
 158
158 -
 159
159 -
 160
160 -
 161
161 -
 162
162 -
 163
163 -
 164
164 -
 165
165 -
 166
166 -
 167
167 -
 168
168 -
 169
169 -
 170
170 -
 171
171 -
172
-
173
-
174
-
175
-
176
-
177
-
178
-
179
-
180
-
181
-
182
-
183
-
184
-
185
-
186
-
187
-
188
 |
 |

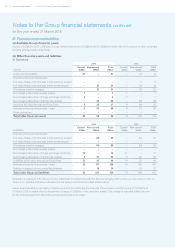
159•Notes to the Group nancial statementsFinancial statements
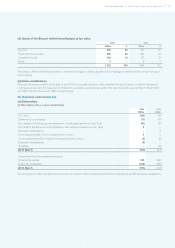
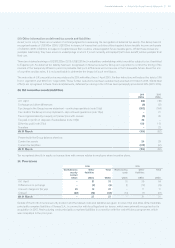
(b) Movements in net post-employment benefit assets/(obligations) recognised in the balance sheet
Fair value of
plan assets
US$m
Present value of obligations Net post-
employment
benefit
assets/
(obligations)
US$m
Defined
benefit
pensions –
funded
US$m
Defined
benefit
pensions –
unfunded
US$m
Post-
employment
medical
benefits
US$m
Total
US$m
At 1 April 2015 1,094 (1,036) (52) (8) (1,096) (2)
Income statement (charge)/credit:
Current service cost – (7) – – (7) (7)
Curtailment gain – 1 – – 1 1
Administration expenses – (2) – – (2) (2)
Interest income/(expense) 37 (35) (2) – (37) –
Total (charge)/credit to income statement 37 (43) (2) – (45) (8)
Remeasurements:
Return on plan assets other than interest (50) – – – – (50)
Gains from change in financial assumptions – 17 1 – 18 18
Experience gains – – 1 1 2 2
Remeasurement of post-employment benefit
assets and obligations (50) 17 2 1 20 (30)
Differences on exchange (27) 27 – – 27 –
Contributions paid by the Group 10 – – 1 1 11
Contributions paid by employees 2 (2) – – (2) –
Benefits paid (43) 40 3 – 43 –
At 31 March 2016 1,023 (997) (49) (6) (1,052) (29)
Fair value of
plan assets
US$m
Present value of obligations Net post-
employment
benefit
assets/
(obligations)
US$m
Defined
benefit
pensions –
funded
US$m
Defined
benefit
pensions –
unfunded
US$m
Post-
employment
medical
benefits
US$m
Total
US$m
At 1 April 2014 1,104 (1,030) (50) (11) (1,091) 13
Income statement (charge)/credit:
Current service cost – (7) (1) – (8) (8)
Administration expenses – (2) – – (2) (2)
Interest income/(expense) 46 (43) (2) – (45) 1
Total (charge)/credit to income statement 46 (52) (3) – (55) (9)
Remeasurements:
Return on plan assets other than interest 113 – – – – 113
Losses from change in demographic assumptions – – (2) – (2) (2)
Losses from change in financial assumptions – (124) (3) – (127) (127)
Experience gains/(losses) – – (1) 2 1 1
Remeasurement of post-employment
benefit assets and obligations 113 (124) (6) 2 (128) (15)
Differences on exchange (136) 129 5 – 134 (2)
Contributions paid by the Group 8 – 2 1 3 11
Contributions paid by employees 3 (3) – – (3) –
Benefits paid (44) 44 – – 44 –
At 31 March 2015 1,094 (1,036) (52) (8) (1,096) (2)