Experian 2016 Annual Report Download - page 50
Download and view the complete annual report
Please find page 50 of the 2016 Experian annual report below. You can navigate through the pages in the report by either clicking on the pages listed below, or by using the keyword search tool below to find specific information within the annual report.-
 1
1 -
2
-
3
-
4
-
5
-
6
-
7
-
8
-
9
-
10
-
11
-
12
-
13
-
14
-
15
-
16
-
17
-
18
-
19
-
20
-
21
-
22
-
23
-
24
-
25
-
26
-
27
-
28
-
29
-
30
-
31
-
32
-
33
-
34
-
35
-
36
-
37
-
38
-
39
-
 40
40 -
 41
41 -
 42
42 -
 43
43 -
 44
44 -
 45
45 -
 46
46 -
 47
47 -
 48
48 -
 49
49 -
 50
50 -
 51
51 -
 52
52 -
 53
53 -
 54
54 -
 55
55 -
 56
56 -
 57
57 -
 58
58 -
 59
59 -
 60
60 -
61
-
62
-
63
-
64
-
65
-
66
-
67
-
68
-
69
-
70
-
71
-
72
-
73
-
74
-
75
-
76
-
77
-
78
-
79
-
80
-
81
-
82
-
83
-
84
-
85
-
86
-
87
-
88
-
89
-
90
-
91
-
92
-
93
-
94
-
95
-
96
-
97
-
98
-
99
-
100
-
101
-
102
-
103
-
104
-
105
-
106
-
107
-
108
-
109
-
110
-
111
-
112
-
113
-
114
-
115
-
116
-
117
-
118
-
119
-
120
-
121
-
122
-
123
-
124
-
125
-
126
-
127
-
128
-
129
-
130
-
131
-
132
-
133
-
134
-
135
-
136
-
137
-
138
-
139
-
140
-
141
-
142
-
143
-
144
-
145
-
146
-
147
-
148
-
149
-
150
-
151
-
152
-
153
-
154
-
155
-
156
-
157
-
158
-
159
-
160
-
161
-
162
-
163
-
164
-
165
-
166
-
167
-
168
-
169
-
170
-
171
-
172
-
173
-
174
-
175
-
176
-
177
-
178
-
179
-
180
-
181
-
182
-
183
-
184
-
185
-
186
-
187
-
188
 |
 |

48
Performance for Growth
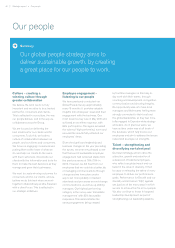
Performance for Growth is our globally
consistent performance management
process, which is now well embedded
across the organisation. It aligns
individual goals to the business strategy
and enables employees to access a
wide range of learning and development
activities, through our Education
Express learning management system.
The process encourages ongoing
performance and development
conversations for continuing personal
growth, leading to even stronger
business results.
We continue to align performance with
reward and this year will introduce
a simplified and globally aligned
reward process, allowing managers
to make total compensation decisions
across their teams, including globally
dispersed teams. To enable this, we
are implementing a leading-edge HR IT
system, to provide global consistency
and stronger governance and facilitate
global alignment of reward practices
linked to performance.
Continued emphasis on
diversity and inclusion
Our objective is to create an environment
in which everyone can flourish,
irrespective of their gender, ethnicity,
thinking style, experience, age, sexual
orientation, physical ability and
economic background. This aligns to
our talent strategy and the inclusiveness
and sense of belonging embodied in
our culture. Each region has agreed
D&I action plans based on our global
framework and we track progress as
part of our Global Talent Review.
In continuing our roadmap for D&I,
which we see as critical to building high-
performance teams, we have developed
a virtual learning webinar called ‘Get
Inclusive’, which will help managers and
employees understand how to leverage
the diversity in their teams and to be
aware of, and limit, any bias in their
people-related decisions. This will also
allow managers and employees to learn
from each other, creating awareness and
support for valuing and benefiting from
the rich diversity within our organisation.
We have a significant Millennial
employee base (49% globally) and
experience greater attrition across
this group than for other generational
groups. It is well understood that
Millennials are less likely to see long
tenure as a career goal and so we have
worked hard to enhance retention
levels in this key employee group. We
have developed an in-house predictive
analytics tool that considers a range of
factors to identify individuals who are
at highest risk of leaving. We can then
target pre-emptive actions.
As of December 2015, 45% of our
global employee base are female
(7,591) and 55% are male (9,423). In
terms of ethnicity, 28% (4,740) classify
themselves as white and 14% (2,394) as
non-white. The remaining 58% (9,880)
are not classified, either because local
legislation does not allow us to request
this data or because employees elect
not to disclose it. The average age of
our workforce is 37.
Senior leader diversity mix
September
2008
September
2009
September
2010
September
2011
September
2012
September
2013
December
2014
December
2015
Total no. of senior leaders* 87 87 90 85 89 92 91 94
Gender:
Female senior leaders (%) 11 (13%) 14 (16%) 16 (18%) 16 (19%) 17 (20%) 20 (22%) 23 (25%) 23 (24%)
Ethnic origin (% non-white) 6 (7%) 4 (5%) 6 (7%) 8 (9%) 8 (9%) 9 (10%) 11 (12 %) 11 (12 %)
* numbers exclude vacancies
Key people facts
45% 37 55% 49%
of our global
employees
are female
of our global
employees
are male
Gender split of employees
is the average age
of our workforce
of our workforce
is now classed
as Millennial
Generational diversity
Our people continued
Strategic report •Our people