Experian 2016 Annual Report Download - page 37
Download and view the complete annual report
Please find page 37 of the 2016 Experian annual report below. You can navigate through the pages in the report by either clicking on the pages listed below, or by using the keyword search tool below to find specific information within the annual report.-
 1
1 -
2
-
3
-
4
-
5
-
6
-
7
-
8
-
9
-
10
-
11
-
12
-
13
-
14
-
15
-
16
-
17
-
18
-
19
-
20
-
21
-
22
-
23
-
24
-
25
-
26
-
 27
27 -
 28
28 -
 29
29 -
 30
30 -
 31
31 -
 32
32 -
 33
33 -
 34
34 -
 35
35 -
 36
36 -
 37
37 -
 38
38 -
 39
39 -
 40
40 -
 41
41 -
 42
42 -
 43
43 -
 44
44 -
 45
45 -
 46
46 -
 47
47 -
48
-
49
-
50
-
51
-
52
-
53
-
54
-
55
-
56
-
57
-
58
-
59
-
60
-
61
-
62
-
63
-
64
-
65
-
66
-
67
-
68
-
69
-
70
-
71
-
72
-
73
-
74
-
75
-
76
-
77
-
78
-
79
-
80
-
81
-
82
-
83
-
84
-
85
-
86
-
87
-
88
-
89
-
90
-
91
-
92
-
93
-
94
-
95
-
96
-
97
-
98
-
99
-
100
-
101
-
102
-
103
-
104
-
105
-
106
-
107
-
108
-
109
-
110
-
111
-
112
-
113
-
114
-
115
-
116
-
117
-
118
-
119
-
120
-
121
-
122
-
123
-
124
-
125
-
126
-
127
-
128
-
129
-
130
-
131
-
132
-
133
-
134
-
135
-
136
-
137
-
138
-
139
-
140
-
141
-
142
-
143
-
144
-
145
-
146
-
147
-
148
-
149
-
150
-
151
-
152
-
153
-
154
-
155
-
156
-
157
-
158
-
159
-
160
-
161
-
162
-
163
-
164
-
165
-
166
-
167
-
168
-
169
-
170
-
171
-
172
-
173
-
174
-
175
-
176
-
177
-
178
-
179
-
180
-
181
-
182
-
183
-
184
-
185
-
186
-
187
-
188
 |
 |

35
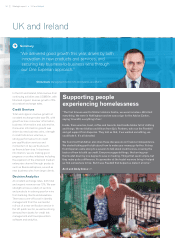
Marketing Services
At constant exchange rates, total
revenue growth in Marketing Services
was flat and organic revenue declined
by 1%. We delivered growth in data,
which has benefited from investments
we’ve made in targeted advertising in
digital channels and in cross-channel
marketing. This offset softness in email
marketing. We also continue to see
good forward bookings for our data
quality business.
Consumer Services
At constant exchange rates total and
organic revenue growth was 4%. Growth
was driven by higher D2C memberships
for Experian CreditExpert in the first
half of the year.
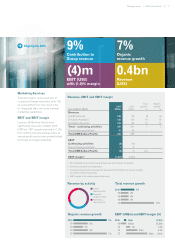
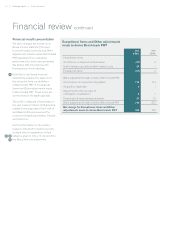
EBIT and EBIT margin
For the UK and Ireland, EBIT from
continuing activities was US$300m,
up 4% at constant exchange rates.
The EBIT margin was 31.4%
(2015: 31.7%), reflecting organic
investment in growth initiatives,
higher legal and regulatory costs
and the impact of foreign exchange.
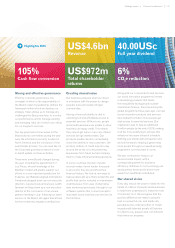
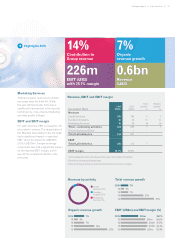
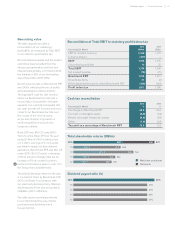
300m 31.4%
308m 31.7%
284m 30.1%
246m 28.2%
227m 27.5%
Credit
Services 29%
Decision
Analytics 24%
Marketing
Services 20%
Consumer
Services 27%
5%
5%
7%
7%
10%
Year ended 31 March
2016
US$m
20151
US$m
Total
growth2
%
Organic
growth2
%
Revenue
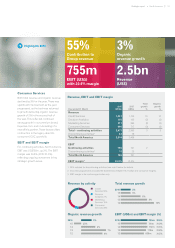
Credit Services 275 277 6 6
Decision Analytics 234 224 12 12
Marketing Services 192 207 –(1)
Consumer Services 255 263 4 4
Total – continuing activities 956 971 5 5
Discontinuing activities315 28
Total UK and Ireland 971 999
EBIT
Continuing activities 300 308 4
Discontinuing activities336
Total UK and Ireland 303 314
EBIT margin431.4% 31.7%
1 2015 restated for discontinuing activities (see note 3 below for details).
2 Growth at constant exchange rates.
3 Discontinuing activities includes the divestments of FootFall and Consumer Insights.
4 EBIT margin is for continuing activities only.
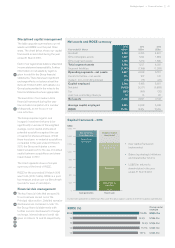
7%
4%
5%
8%
5%
22% 5%
Contribution to
Group revenue
Organic
revenue growth
300m
EBIT (US$)
with 31.4% margin
1.0bn
Revenue
(US$)
Revenue by activity Total revenue growth
Organic revenue growth EBIT (US$m) and EBIT margin (%)
2016
2016
15
15
14
14
13
13
12
12
2016
15
14
13
12
Revenue, EBIT and EBIT margin
Highlights 2016
Strategic report •UK and Ireland