Experian 2016 Annual Report Download - page 119
Download and view the complete annual report
Please find page 119 of the 2016 Experian annual report below. You can navigate through the pages in the report by either clicking on the pages listed below, or by using the keyword search tool below to find specific information within the annual report.-
 1
1 -
2
-
3
-
4
-
5
-
6
-
7
-
8
-
9
-
10
-
11
-
12
-
13
-
14
-
15
-
16
-
17
-
18
-
19
-
20
-
21
-
22
-
23
-
24
-
25
-
26
-
27
-
28
-
29
-
30
-
31
-
32
-
33
-
34
-
35
-
36
-
37
-
38
-
39
-
40
-
41
-
42
-
43
-
44
-
45
-
46
-
47
-
48
-
49
-
50
-
51
-
52
-
53
-
54
-
55
-
56
-
57
-
58
-
59
-
60
-
61
-
62
-
63
-
64
-
65
-
66
-
67
-
68
-
69
-
70
-
71
-
72
-
73
-
74
-
75
-
76
-
77
-
78
-
79
-
80
-
81
-
82
-
83
-
84
-
85
-
86
-
87
-
88
-
89
-
90
-
91
-
92
-
93
-
94
-
95
-
96
-
97
-
98
-
99
-
100
-
101
-
102
-
103
-
104
-
105
-
106
-
107
-
108
-
 109
109 -
 110
110 -
 111
111 -
 112
112 -
 113
113 -
 114
114 -
 115
115 -
 116
116 -
 117
117 -
 118
118 -
 119
119 -
 120
120 -
 121
121 -
 122
122 -
 123
123 -
 124
124 -
 125
125 -
 126
126 -
 127
127 -
 128
128 -
 129
129 -
130
-
131
-
132
-
133
-
134
-
135
-
136
-
137
-
138
-
139
-
140
-
141
-
142
-
143
-
144
-
145
-
146
-
147
-
148
-
149
-
150
-
151
-
152
-
153
-
154
-
155
-
156
-
157
-
158
-
159
-
160
-
161
-
162
-
163
-
164
-
165
-
166
-
167
-
168
-
169
-
170
-
171
-
172
-
173
-
174
-
175
-
176
-
177
-
178
-
179
-
180
-
181
-
182
-
183
-
184
-
185
-
186
-
187
-
188
 |
 |

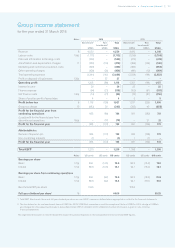
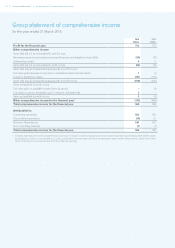
117•Financial statements Group cash ow statement
Group cash flow statement
for the year ended 31 March 2016
Notes 2016
US$m
2015
US$m
Cash flows from operating activities
Cash generated from operations 37(a) 1,570 1,720
Interest paid (86) (96)
Interest received 20 22
Dividends received from associates 3 4
Tax paid 37(c) (136) (145)
Net cash inflow from operating activities – continuing operations 1,371 1,505
Net cash inflow from operating activities – discontinued operations 16(a) – 32
Net cash inflow from operating activities 1,371 1,537
Cash flows from investing activities
Purchase of other intangible assets (271) (316)
Purchase of property, plant and equipment (68) (64)
Sale of property, plant and equipment 13 2
(Purchase)/sale of other financial assets (2) 7
Acquisition of subsidiaries, net of cash acquired 37(d) (13) (58)
Disposal of subsidiaries – continuing operations 13(b) 150 18
Disposal of subsidiaries – discontinued operations 16(b) 13 (9)
Net cash flows used in investing activities (178) (420)
Cash flows from financing activities
Cash inflow in respect of net share purchases 37(e) 13 16
Cash outflow in respect of net share purchases 37(e) (605) (208)
Other payments on vesting of share awards (5) (6)
Payments to acquire non-controlling interests (6) (8)
New borrowings 204 –
Repayment of borrowings (361) (539)
Net payments for derivative financial instruments held to manage currency profile (29) (2)
Net receipts from equity swaps 1 2
Dividends paid (383) (379)
Net cash flows used in financing activities (1,171) (1,124)
Net increase/(decrease) in cash and cash equivalents 22 (7)
Cash and cash equivalents at 1 April 145 208
Exchange movements on cash and cash equivalents (16) (56)
Cash and cash equivalents at 31 March 37(f) 151 145