Experian 2016 Annual Report Download - page 134
Download and view the complete annual report
Please find page 134 of the 2016 Experian annual report below. You can navigate through the pages in the report by either clicking on the pages listed below, or by using the keyword search tool below to find specific information within the annual report.-
 1
1 -
2
-
3
-
4
-
5
-
6
-
7
-
8
-
9
-
10
-
11
-
12
-
13
-
14
-
15
-
16
-
17
-
18
-
19
-
20
-
21
-
22
-
23
-
24
-
25
-
26
-
27
-
28
-
29
-
30
-
31
-
32
-
33
-
34
-
35
-
36
-
37
-
38
-
39
-
40
-
41
-
42
-
43
-
44
-
45
-
46
-
47
-
48
-
49
-
50
-
51
-
52
-
53
-
54
-
55
-
56
-
57
-
58
-
59
-
60
-
61
-
62
-
63
-
64
-
65
-
66
-
67
-
68
-
69
-
70
-
71
-
72
-
73
-
74
-
75
-
76
-
77
-
78
-
79
-
80
-
81
-
82
-
83
-
84
-
85
-
86
-
87
-
88
-
89
-
90
-
91
-
92
-
93
-
94
-
95
-
96
-
97
-
98
-
99
-
100
-
101
-
102
-
103
-
104
-
105
-
106
-
107
-
108
-
109
-
110
-
111
-
112
-
113
-
114
-
115
-
116
-
117
-
118
-
119
-
120
-
121
-
122
-
123
-
 124
124 -
 125
125 -
 126
126 -
 127
127 -
 128
128 -
 129
129 -
 130
130 -
 131
131 -
 132
132 -
 133
133 -
 134
134 -
 135
135 -
 136
136 -
 137
137 -
 138
138 -
 139
139 -
 140
140 -
 141
141 -
 142
142 -
 143
143 -
 144
144 -
145
-
146
-
147
-
148
-
149
-
150
-
151
-
152
-
153
-
154
-
155
-
156
-
157
-
158
-
159
-
160
-
161
-
162
-
163
-
164
-
165
-
166
-
167
-
168
-
169
-
170
-
171
-
172
-
173
-
174
-
175
-
176
-
177
-
178
-
179
-
180
-
181
-
182
-
183
-
184
-
185
-
186
-
187
-
188
 |
 |

132
Notes to the Group financial statements continued
for the year ended 31 March 2016
Financial statements •Notes to the Group nancial statements
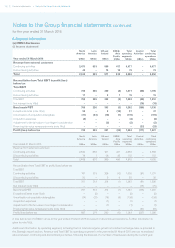
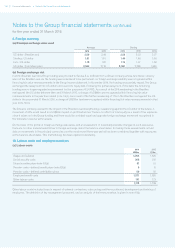
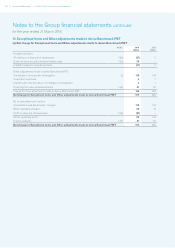
8. Segment information continued
(a) IFRS 8 disclosures continued
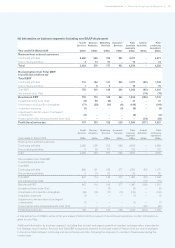
(iii) Capital expenditure, amortisation and depreciation
Capital expenditure Amortisation Depreciation
2016
US$m
2015
US$m
2016
US$m
2015
US$m
2016
US$m
2015
US$m
North America 148 151 114 117 47 54
Latin America 79 91 53 71 8 12
UK and Ireland 57 57 34 31 17 21
EMEA/Asia Pacific 33 47 31 35 8 10
Total operating segments 317 346 232 254 80 97
Central Activities 22 34 38 30 3 3
Total Group 339 380 270 284 83 100
Amortisation and depreciation above only include amounts charged to Benchmark PBT.
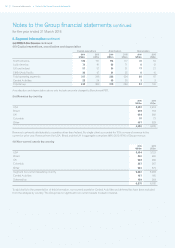
(iv) Revenue by country
2016
US$m
2015
US$m
USA 2,503 2,453
Brazil 559 763
UK 964 992
Colombia 57 73
Other 467 529
4,550 4,810
Revenue is primarily attributable to countries other than Ireland. No single client accounted for 10% or more of revenue in the
current or prior year. Revenue from the USA, Brazil and the UK in aggregate comprises 88% (2015: 87%) of Group revenue.
(v) Non-current assets by country
2016
US$m
2015
US$m
USA 3,494 3,723
Brazil 830 920
UK 928 994
Colombia 227 267
Other 503 579
Segment non-current assets by country 5,982 6,483
Central Activities 137 165
Deferred tax 159 264
6,278 6,912
To add clarity to the presentation of this information, non-current assets for Central Activities and deferred tax have been excluded
from the analysis by country. The Group has no significant non-current assets located in Ireland.