Experian 2016 Annual Report Download - page 35
Download and view the complete annual report
Please find page 35 of the 2016 Experian annual report below. You can navigate through the pages in the report by either clicking on the pages listed below, or by using the keyword search tool below to find specific information within the annual report.-
 1
1 -
2
-
3
-
4
-
5
-
6
-
7
-
8
-
9
-
10
-
11
-
12
-
13
-
14
-
15
-
16
-
17
-
18
-
19
-
20
-
21
-
22
-
23
-
24
-
 25
25 -
 26
26 -
 27
27 -
 28
28 -
 29
29 -
 30
30 -
 31
31 -
 32
32 -
 33
33 -
 34
34 -
 35
35 -
 36
36 -
 37
37 -
 38
38 -
 39
39 -
 40
40 -
 41
41 -
 42
42 -
 43
43 -
 44
44 -
 45
45 -
46
-
47
-
48
-
49
-
50
-
51
-
52
-
53
-
54
-
55
-
56
-
57
-
58
-
59
-
60
-
61
-
62
-
63
-
64
-
65
-
66
-
67
-
68
-
69
-
70
-
71
-
72
-
73
-
74
-
75
-
76
-
77
-
78
-
79
-
80
-
81
-
82
-
83
-
84
-
85
-
86
-
87
-
88
-
89
-
90
-
91
-
92
-
93
-
94
-
95
-
96
-
97
-
98
-
99
-
100
-
101
-
102
-
103
-
104
-
105
-
106
-
107
-
108
-
109
-
110
-
111
-
112
-
113
-
114
-
115
-
116
-
117
-
118
-
119
-
120
-
121
-
122
-
123
-
124
-
125
-
126
-
127
-
128
-
129
-
130
-
131
-
132
-
133
-
134
-
135
-
136
-
137
-
138
-
139
-
140
-
141
-
142
-
143
-
144
-
145
-
146
-
147
-
148
-
149
-
150
-
151
-
152
-
153
-
154
-
155
-
156
-
157
-
158
-
159
-
160
-
161
-
162
-
163
-
164
-
165
-
166
-
167
-
168
-
169
-
170
-
171
-
172
-
173
-
174
-
175
-
176
-
177
-
178
-
179
-
180
-
181
-
182
-
183
-
184
-
185
-
186
-
187
-
188
 |
 |

33
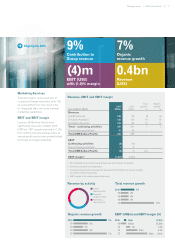
Marketing Services
Total and organic revenue at constant
exchange rates declined 4%. While
the year started weakly, there was a
significant improvement in the second
half driven by cross-channel marketing
and data quality in Brazil.
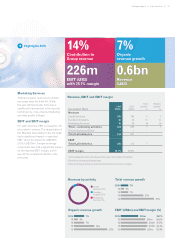
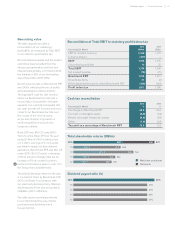
EBIT and EBIT margin
For Latin America, EBIT increased by 7%
at constant currency. The depreciation of
the Brazilian real relative to the US dollar
had a significant impact on reported
EBIT, which decreased to US$226m
(2015: US$313m). Foreign exchange
movements also had a significant impact
on the reported EBIT margin, which
was 35.7% compared to 36.6% in the
prior year.
Year ended 31 March
2016
US$m
20151
US$m
Total
growth2
%
Organic
growth2
%
Revenue
Credit Services 579 782 7 7
Decision Analytics 36 46 10 10
Marketing Services 18 28 (4) (4)
Total – continuing activities 633 856 7 7
Discontinuing activities3–1
Total Latin America 633 857
EBIT
Total Latin America 226 313 7
EBIT margin 35.7% 36.6%
1 2015 restated for discontinuing activities (see note 3 below for details).
2 Growth at constant exchange rates.
3 Discontinuing activities include the divestment of Consumer Insights.
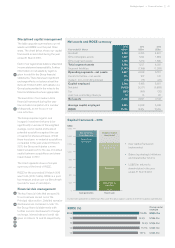
226m
313m
344m
343m
320m
Credit
Services 91%
Decision
Analytics 6%
Marketing
Services 3%
7%
3%
7%
23%
14%
7%
3%
7%
21%
31%
35.7%
37.2%
36.6%
35.7%
33.3%
14% 7%
Contribution to
Group revenue
Organic
revenue growth
226m
EBIT (US$)
with 35.7% margin
0.6bn
Revenue
(US$)
Revenue by activity
20162016
2016
1515
15
1414
14
1313
13
1212
12
Total revenue growth
Organic revenue growth EBIT (US$m) and EBIT margin (%)
Revenue, EBIT and EBIT margin
Highlights 2016
Strategic report •Latin America