Experian 2016 Annual Report Download - page 89
Download and view the complete annual report
Please find page 89 of the 2016 Experian annual report below. You can navigate through the pages in the report by either clicking on the pages listed below, or by using the keyword search tool below to find specific information within the annual report.-
 1
1 -
2
-
3
-
4
-
5
-
6
-
7
-
8
-
9
-
10
-
11
-
12
-
13
-
14
-
15
-
16
-
17
-
18
-
19
-
20
-
21
-
22
-
23
-
24
-
25
-
26
-
27
-
28
-
29
-
30
-
31
-
32
-
33
-
34
-
35
-
36
-
37
-
38
-
39
-
40
-
41
-
42
-
43
-
44
-
45
-
46
-
47
-
48
-
49
-
50
-
51
-
52
-
53
-
54
-
55
-
56
-
57
-
58
-
59
-
60
-
61
-
62
-
63
-
64
-
65
-
66
-
67
-
68
-
69
-
70
-
71
-
72
-
73
-
74
-
75
-
76
-
77
-
78
-
 79
79 -
 80
80 -
 81
81 -
 82
82 -
 83
83 -
 84
84 -
 85
85 -
 86
86 -
 87
87 -
 88
88 -
 89
89 -
 90
90 -
 91
91 -
 92
92 -
 93
93 -
 94
94 -
 95
95 -
 96
96 -
 97
97 -
 98
98 -
 99
99 -
100
-
101
-
102
-
103
-
104
-
105
-
106
-
107
-
108
-
109
-
110
-
111
-
112
-
113
-
114
-
115
-
116
-
117
-
118
-
119
-
120
-
121
-
122
-
123
-
124
-
125
-
126
-
127
-
128
-
129
-
130
-
131
-
132
-
133
-
134
-
135
-
136
-
137
-
138
-
139
-
140
-
141
-
142
-
143
-
144
-
145
-
146
-
147
-
148
-
149
-
150
-
151
-
152
-
153
-
154
-
155
-
156
-
157
-
158
-
159
-
160
-
161
-
162
-
163
-
164
-
165
-
166
-
167
-
168
-
169
-
170
-
171
-
172
-
173
-
174
-
175
-
176
-
177
-
178
-
179
-
180
-
181
-
182
-
183
-
184
-
185
-
186
-
187
-
188
 |
 |

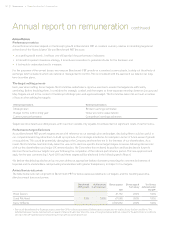
In determining the outcome for the annual bonus, the Committee considers whether the payouts adequately reflect the Group’s
wider business performance over the course of the year. During the year, the Committee considered performance to be strong,
particularly in the light of a number of factors, including:
• the challenging economic environment in Brazil over the past year, despite which our Brazilian business has delivered strong
results; and
• market shifts in North America which have significantly affected our Consumer Services business and the actions taken by our
leadership team to reposition the business which have seen a return to growth.
Despite these challenges, we achieved growth in Benchmark PBT of 5.3% at constant currency. In the context of the Group’s
underlying performance during the year, the Committee was satisfied that this level of bonus payment was appropriate.
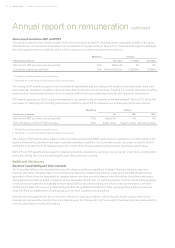
Share-based incentives
The amount included in the single total figure of remuneration is the combined value of the CIP and PSP awards vesting in respect
of the relevant financial year. For 2015, these relate to the awards granted on 18 May 2012 and for 2016 they relate to the awards
granted on 6 June 2013. Vesting in 2016 for both the CIP and PSP awards depended on performance over the three years ended
31 March 2016 as well as continued service.
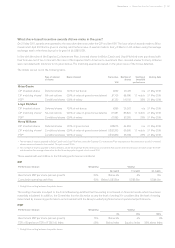
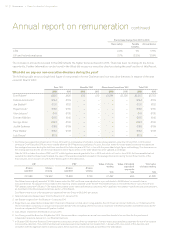
The performance achieved against the targets for CIP and PSP awards granted in June 2013 is shown in the following tables:
CIP awards
Performance measure
Weighting Vesting1Actual Percentage
vesting2
No match 1:1 match 2:1 match
Benchmark PBT (annual growth) 50% Below 7% 7% 14% 6.3% 0%
Cumulative operating cash flow350% Below
US$3.9bn
US$3.9bn US$4.3bn US$4.3bn 47.6%
Total 47.6%
1 Straight-line vesting between the points shown.
2 The maximum opportunity was a 2 for 1 match on the bonus deferred.
3 The Cumulative operating cash flow targets shown above have been increased from those originally set by US$115m to take into account the impact of
acquisitions and disposals made over the performance period. The actual Cumulative operating cash flow over the performance period, of US$4,276m,
is determined on a constant currency basis. This is in line with our approach for all performance metrics, to ensure that awards are measured on a
consistent basis.
PSP awards
Performance measure
Weighting Vesting1Actual Percentage
vesting2
0% 25% 100%
Benchmark PBT (annual growth) 75% Below 7% 7% 14% 6.3% 0%
TSR of Experian vs TSR of FTSE 100 Index 25% Below index Equal to index 25% above
Index
6.8% above
Index
11.3%
Total 11.3%
1 Straight-line vesting between the points shown.
2 The maximum opportunity was the original award with a face value of 200% and 175% of salary for Brian Cassin and Kerry Williams respectively. Vesting
of these awards was also subject to the Committee agreeing that the return on capital employed (‘ROCE’) performance over the period was satisfactory.
Year-end ROCE was 15.4%, and so the Committee was comfortable that the payout determined by applying the performance criteria was appropriate in the
context of this level of performance.
87
Governance •Report on directors’ remuneration