Experian 2016 Annual Report Download - page 12
Download and view the complete annual report
Please find page 12 of the 2016 Experian annual report below. You can navigate through the pages in the report by either clicking on the pages listed below, or by using the keyword search tool below to find specific information within the annual report.-
 1
1 -
 2
2 -
 3
3 -
 4
4 -
 5
5 -
 6
6 -
 7
7 -
 8
8 -
 9
9 -
 10
10 -
 11
11 -
 12
12 -
 13
13 -
 14
14 -
 15
15 -
 16
16 -
 17
17 -
 18
18 -
 19
19 -
 20
20 -
 21
21 -
 22
22 -
23
-
24
-
25
-
26
-
27
-
28
-
29
-
30
-
31
-
32
-
33
-
34
-
35
-
36
-
37
-
38
-
39
-
40
-
41
-
42
-
43
-
44
-
45
-
46
-
47
-
48
-
49
-
50
-
51
-
52
-
53
-
54
-
55
-
56
-
57
-
58
-
59
-
60
-
61
-
62
-
63
-
64
-
65
-
66
-
67
-
68
-
69
-
70
-
71
-
72
-
73
-
74
-
75
-
76
-
77
-
78
-
79
-
80
-
81
-
82
-
83
-
84
-
85
-
86
-
87
-
88
-
89
-
90
-
91
-
92
-
93
-
94
-
95
-
96
-
97
-
98
-
99
-
100
-
101
-
102
-
103
-
104
-
105
-
106
-
107
-
108
-
109
-
110
-
111
-
112
-
113
-
114
-
115
-
116
-
117
-
118
-
119
-
120
-
121
-
122
-
123
-
124
-
125
-
126
-
127
-
128
-
129
-
130
-
131
-
132
-
133
-
134
-
135
-
136
-
137
-
138
-
139
-
140
-
141
-
142
-
143
-
144
-
145
-
146
-
147
-
148
-
149
-
150
-
151
-
152
-
153
-
154
-
155
-
156
-
157
-
158
-
159
-
160
-
161
-
162
-
163
-
164
-
165
-
166
-
167
-
168
-
169
-
170
-
171
-
172
-
173
-
174
-
175
-
176
-
177
-
178
-
179
-
180
-
181
-
182
-
183
-
184
-
185
-
186
-
187
-
188
 |
 |

10
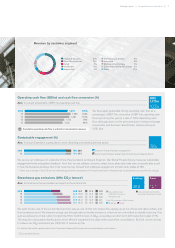
Key performance indicators
Measuring our business, whether in financial, employee-related or
environmental terms, allows us to assess how well we have performed
relative to our strategic and operational plans over the past year.
Our key performance indicators show how we have delivered on our
commitments, so that we can build on that success and shape
our future strategy.
Summary
Organic revenue growth (%)
Aim: To deliver mid single-digit organic revenue
growth consistently
Benchmark PBT per share from continuing activities
at constant rates is a directors’ remuneration measure
EBIT (US$m) and EBIT margin (%)
Aim: To operate our business efficiently and
cost effectively
We measure EBIT and EBIT margin as they show how well
we turn revenue growth into profitability and help us allocate
resources. This year, EBIT was US$1,195m, down 6% at actual
exchange rates and up 5% at constant rates. EBIT margin from
continuing activities was 26.7%, flat year-on-year before the
impact of foreign exchange rates, down 60 basis points overall.
Both EBIT and EBIT margin relate to continuing activities only, with numbers
reported for 2015 restated to reflect discontinuing activities arising in 2016.
1,195 26.7%2016
15
13
14
12
1,244 27.1%
1,309 27.4%
1,169 26.2%
1,271 27.3%
Benchmark PBT per share (US cents)
Aim: To deliver profit growth, while balancing
investment in the business and
shareholder returns
Return on capital employed (‘ROCE’)
Aim: To generate good returns and deliver long-term
value for shareholders
This is one of the measures we use to track how we are growing
value for our shareholders. This year, Benchmark PBT per share
was 118.6 cents, down 6% at actual exchange rates and up 5%
at constant rates.
118.6
120.3
125.7
114.1
2016
15
13
14
12
126.0
15.4%
15.5%
15.6%
15.1%
2016
15
13
14
ROCE measures the return generated on the capital we have
invested in the business, whether through internal investment
or externally through acquisitions, and reflects our ability to add
shareholder value over the long term. This year ROCE increased
to 15.4%, up 0.5 percentage points on the prior year.
ROCE is a directors’ remuneration measure
14.9%
12
5%
8%
5%
10%
2016
15
13
14
12
We are focused on driving organic revenue growth to deliver
strong growth in Benchmark EPS. This year we have achieved
our aim and organic revenue growth at constant exchange
rates was 5%, which is within our target mid single-digit range.
See the Chief Executive’s review for the main drivers of our
improved performance.
1%
See note 6 to the Group financial statements for definitions of: organic revenue growth, EBIT, ROCE, Benchmark PBT per share, and operating cash flow
and cash flow conversion. Further information is given in the Financial review.
26.7%
US$
1,195m
5%
15.4% 118.6
p90 p89
USc
Strategic report •Key performance indicators