Experian 2016 Annual Report Download - page 43
Download and view the complete annual report
Please find page 43 of the 2016 Experian annual report below. You can navigate through the pages in the report by either clicking on the pages listed below, or by using the keyword search tool below to find specific information within the annual report.-
 1
1 -
2
-
3
-
4
-
5
-
6
-
7
-
8
-
9
-
10
-
11
-
12
-
13
-
14
-
15
-
16
-
17
-
18
-
19
-
20
-
21
-
22
-
23
-
24
-
25
-
26
-
27
-
28
-
29
-
30
-
31
-
32
-
 33
33 -
 34
34 -
 35
35 -
 36
36 -
 37
37 -
 38
38 -
 39
39 -
 40
40 -
 41
41 -
 42
42 -
 43
43 -
 44
44 -
 45
45 -
 46
46 -
 47
47 -
 48
48 -
 49
49 -
 50
50 -
 51
51 -
 52
52 -
 53
53 -
54
-
55
-
56
-
57
-
58
-
59
-
60
-
61
-
62
-
63
-
64
-
65
-
66
-
67
-
68
-
69
-
70
-
71
-
72
-
73
-
74
-
75
-
76
-
77
-
78
-
79
-
80
-
81
-
82
-
83
-
84
-
85
-
86
-
87
-
88
-
89
-
90
-
91
-
92
-
93
-
94
-
95
-
96
-
97
-
98
-
99
-
100
-
101
-
102
-
103
-
104
-
105
-
106
-
107
-
108
-
109
-
110
-
111
-
112
-
113
-
114
-
115
-
116
-
117
-
118
-
119
-
120
-
121
-
122
-
123
-
124
-
125
-
126
-
127
-
128
-
129
-
130
-
131
-
132
-
133
-
134
-
135
-
136
-
137
-
138
-
139
-
140
-
141
-
142
-
143
-
144
-
145
-
146
-
147
-
148
-
149
-
150
-
151
-
152
-
153
-
154
-
155
-
156
-
157
-
158
-
159
-
160
-
161
-
162
-
163
-
164
-
165
-
166
-
167
-
168
-
169
-
170
-
171
-
172
-
173
-
174
-
175
-
176
-
177
-
178
-
179
-
180
-
181
-
182
-
183
-
184
-
185
-
186
-
187
-
188
 |
 |
41
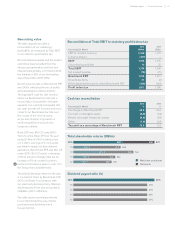
Generating value
The table opposite provides a
reconciliation of our underlying
profitability, as measured by Total EBIT,
to our statutory profit before tax.
Our net interest expense and the related
cash flows have benefited from the
strong cash generation and from low
interest rates globally. At 31 March 2016,
the interest on 91% of our net funding
was at fixed rates (2015: 83%).
Our effective tax rate on Benchmark PBT
was 24.9%, reflecting the mix of profits
and prevailing tax rates by territory.
The equivalent cash tax rate remains
below our Benchmark tax rate and a
reconciliation is provided in the table
opposite. It is currently anticipated that
our cash tax rate will increase and move
closer to our Benchmark tax rate over
the course of the next six years,
as tax amortisation of goodwill on
earlier acquisitions and prior tax
losses are utilised.
Basic EPS was 78.6 US cents (2015:
79.0 US cents). Basic EPS for the year
ended 31 March 2016 included a loss
of 1.3 (2015: earnings of 2.1) US cents
per share in respect of discontinued
operations. Benchmark EPS was 89.1 US
cents (2015: 95.2 US cents), a decrease
of 6% at actual exchange rates but an
increase of 5% at constant currency.
Further information is given in note 17 to
the Group financial statements.
The total dividend per share for the year
is covered 2.2 times by Benchmark EPS
(2015: 2.4 times) in accordance with
our previously declared policy. Ordinary
dividends paid in the year amounted to
US$380m (2015: US$374m).
The table above summarises returns
to our shareholders by way of share
purchases and dividends over a
five-year period.
Reconciliation of Total EBIT to statutory profit before tax
Year ended 31 March
2016
US$m
2015
US$m
EBIT at constant currency 1,332 1,271
Currency impact (137) –
EBIT 1,195 1,271
Discontinuing activities 15 35
Total EBIT 1,210 1,306
Net interest expense (74) (75)
Benchmark PBT 1,136 1,231
Exceptional items 37 (2)
Other adjustments made to derive Benchmark PBT (146) (223)
Profit before tax 1,027 1,006
Cash tax reconciliation
Year ended 31 March
2016
%
2015
%
Tax charge on Benchmark PBT 24.9 24.4
Tax relief on intangible assets (6.5) (7.9)
Benefit of brought forward tax losses (4.6) (3.8)
Other (1.8) (0.9)
Tax paid as a percentage of Benchmark PBT 12.0 11.8
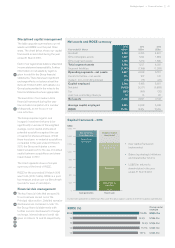
Total shareholder returns (US$m)
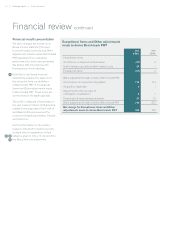
Dividend payout ratio (%)
592
2016
2016
14
14
15
15
13
13
12
12
192
41%
41%
41%
41%
374 566
592
45%
972380
371 349 720
Net share purchases
Dividends
180 322 502
167 290 457
p141
Strategic report •Financial review