Experian 2016 Annual Report Download - page 158
Download and view the complete annual report
Please find page 158 of the 2016 Experian annual report below. You can navigate through the pages in the report by either clicking on the pages listed below, or by using the keyword search tool below to find specific information within the annual report.-
 1
1 -
2
-
3
-
4
-
5
-
6
-
7
-
8
-
9
-
10
-
11
-
12
-
13
-
14
-
15
-
16
-
17
-
18
-
19
-
20
-
21
-
22
-
23
-
24
-
25
-
26
-
27
-
28
-
29
-
30
-
31
-
32
-
33
-
34
-
35
-
36
-
37
-
38
-
39
-
40
-
41
-
42
-
43
-
44
-
45
-
46
-
47
-
48
-
49
-
50
-
51
-
52
-
53
-
54
-
55
-
56
-
57
-
58
-
59
-
60
-
61
-
62
-
63
-
64
-
65
-
66
-
67
-
68
-
69
-
70
-
71
-
72
-
73
-
74
-
75
-
76
-
77
-
78
-
79
-
80
-
81
-
82
-
83
-
84
-
85
-
86
-
87
-
88
-
89
-
90
-
91
-
92
-
93
-
94
-
95
-
96
-
97
-
98
-
99
-
100
-
101
-
102
-
103
-
104
-
105
-
106
-
107
-
108
-
109
-
110
-
111
-
112
-
113
-
114
-
115
-
116
-
117
-
118
-
119
-
120
-
121
-
122
-
123
-
124
-
125
-
126
-
127
-
128
-
129
-
130
-
131
-
132
-
133
-
134
-
135
-
136
-
137
-
138
-
139
-
140
-
141
-
142
-
143
-
144
-
145
-
146
-
147
-
 148
148 -
 149
149 -
 150
150 -
 151
151 -
 152
152 -
 153
153 -
 154
154 -
 155
155 -
 156
156 -
 157
157 -
 158
158 -
 159
159 -
 160
160 -
 161
161 -
 162
162 -
 163
163 -
 164
164 -
 165
165 -
 166
166 -
 167
167 -
 168
168 -
169
-
170
-
171
-
172
-
173
-
174
-
175
-
176
-
177
-
178
-
179
-
180
-
181
-
182
-
183
-
184
-
185
-
186
-
187
-
188
 |
 |

156
Notes to the Group financial statements continued
for the year ended 31 March 2016
Financial statements •Notes to the Group nancial statements
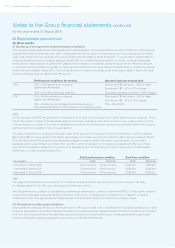
30. Share incentive plans continued
(b) Share awards
(i) Summary of arrangements and performance conditions
There are three plans under which share awards are currently granted – the two Experian Co-Investment Plans (the ‘CIPs’) and the
Experian Performance Share Plan (the ‘PSP’). Awards take the form of a grant of shares which vest over a service period of three
years, with a maximum term generally of the same length, and are settled by share distribution. The assumption at grant date for
employee departures prior to vesting is between 5% and 10% for conditional awards and 20% for certain unconditional awards
which are only made under the Experian PSP. Other details in respect of conditional awards are given below. These now include
an assumed outcome for Benchmark PBT per share growth as that forms the basis of the Profit performance condition for awards
made in the year ended 31 March 2016. The Profit performance condition for awards made in the years ended 31 March 2015 and
31 March 2014 was based on Benchmark PBT growth.
Performance conditions for vesting Assumed outcome at grant date
CIPs 50% – Profit performance assessed
against specified targets
Benchmark PBT per share – 100% of target
Benchmark PBT – 67% to 71% of target
50% – Cumulative operating cash flow Cumulative operating cash flow – 100% of target
PSP 75% – Profit performance assessed
against specified targets
Benchmark PBT per share – 100% of target
Benchmark PBT – 67% to 71% of target
25% – Distribution percentage determined by ranking
Total Shareholder Return (‘TSR’) relative to a comparator group
TSR – 45% to 50%
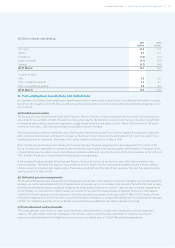
CIPs
For the purposes of IFRS 2, the grant date for these plans is the start of the financial year in which performance is assessed. This is
before the number of shares to be awarded is determined but the underlying value of the award is known, subject to the outcome
of the performance condition. The value of awarded shares reflects the performance outcome assumed at the date of their issue to
participants and is recognised over a four-year period.
The range of performance conditions for awards under these plans are set out below. The profit performance condition requires
Benchmark PBT per share growth at the stated percentages over a three-year period for awards made in the year ended 31 March
2016, with Benchmark PBT growth at the stated percentages for awards made in the earlier years reported. The cumulative
operating cash flow performance condition (the ‘cash flow condition’) is based on cumulative operating cash flow over a three-
year period. The period of assessment commences at the beginning of the financial year of grant. These are not market-based
performance conditions as defined by IFRS 2.
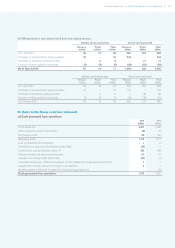
Year of award
Profit performance condition Cash flow condition
Target Maximum Target Maximum
Year ended 31 March 2016 4% per annum 8% per annum US$3.6bn US$4.0bn
Year ended 31 March 2015 7% per annum 14% per annum US$4.0bn US$4.4bn
Year ended 31 March 2014 7% per annum 14% per annum US$3.8bn US$4.2bn
PSP
The range of profit performance conditions for conditional awards under this plan is the same as those shown in the table
immediately above for the CIPs, also measured over a three-year period.
The TSR performance condition is considered a market-based performance condition as defined by IFRS 2. In valuing the awarded
shares, TSR is evaluated using a Monte Carlo simulation, with historic volatilities and correlations for comparator companies
measured over the three-year period preceding valuation and an implied volatility for Experian plc ordinary shares.
(ii) Information on share grant valuations
Share grants are valued by reference to the market price on the day of award, with no modification for dividend distributions or other
factors as participants are entitled to dividend distributions on awarded shares. Market-based performance conditions are included
in the fair value measurement on the grant date and are not revised for actual performance. Awards granted in the year ended
31 March 2016 had a weighted average fair value per share of £11.84 (2015: £10.26).