Experian 2016 Annual Report Download - page 44
Download and view the complete annual report
Please find page 44 of the 2016 Experian annual report below. You can navigate through the pages in the report by either clicking on the pages listed below, or by using the keyword search tool below to find specific information within the annual report.-
 1
1 -
2
-
3
-
4
-
5
-
6
-
7
-
8
-
9
-
10
-
11
-
12
-
13
-
14
-
15
-
16
-
17
-
18
-
19
-
20
-
21
-
22
-
23
-
24
-
25
-
26
-
27
-
28
-
29
-
30
-
31
-
32
-
33
-
 34
34 -
 35
35 -
 36
36 -
 37
37 -
 38
38 -
 39
39 -
 40
40 -
 41
41 -
 42
42 -
 43
43 -
 44
44 -
 45
45 -
 46
46 -
 47
47 -
 48
48 -
 49
49 -
 50
50 -
 51
51 -
 52
52 -
 53
53 -
 54
54 -
55
-
56
-
57
-
58
-
59
-
60
-
61
-
62
-
63
-
64
-
65
-
66
-
67
-
68
-
69
-
70
-
71
-
72
-
73
-
74
-
75
-
76
-
77
-
78
-
79
-
80
-
81
-
82
-
83
-
84
-
85
-
86
-
87
-
88
-
89
-
90
-
91
-
92
-
93
-
94
-
95
-
96
-
97
-
98
-
99
-
100
-
101
-
102
-
103
-
104
-
105
-
106
-
107
-
108
-
109
-
110
-
111
-
112
-
113
-
114
-
115
-
116
-
117
-
118
-
119
-
120
-
121
-
122
-
123
-
124
-
125
-
126
-
127
-
128
-
129
-
130
-
131
-
132
-
133
-
134
-
135
-
136
-
137
-
138
-
139
-
140
-
141
-
142
-
143
-
144
-
145
-
146
-
147
-
148
-
149
-
150
-
151
-
152
-
153
-
154
-
155
-
156
-
157
-
158
-
159
-
160
-
161
-
162
-
163
-
164
-
165
-
166
-
167
-
168
-
169
-
170
-
171
-
172
-
173
-
174
-
175
-
176
-
177
-
178
-
179
-
180
-
181
-
182
-
183
-
184
-
185
-
186
-
187
-
188
 |
 |
42
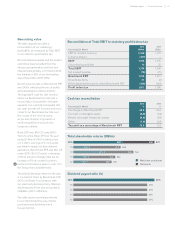
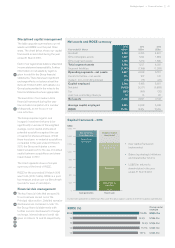
Cash and liquidity management
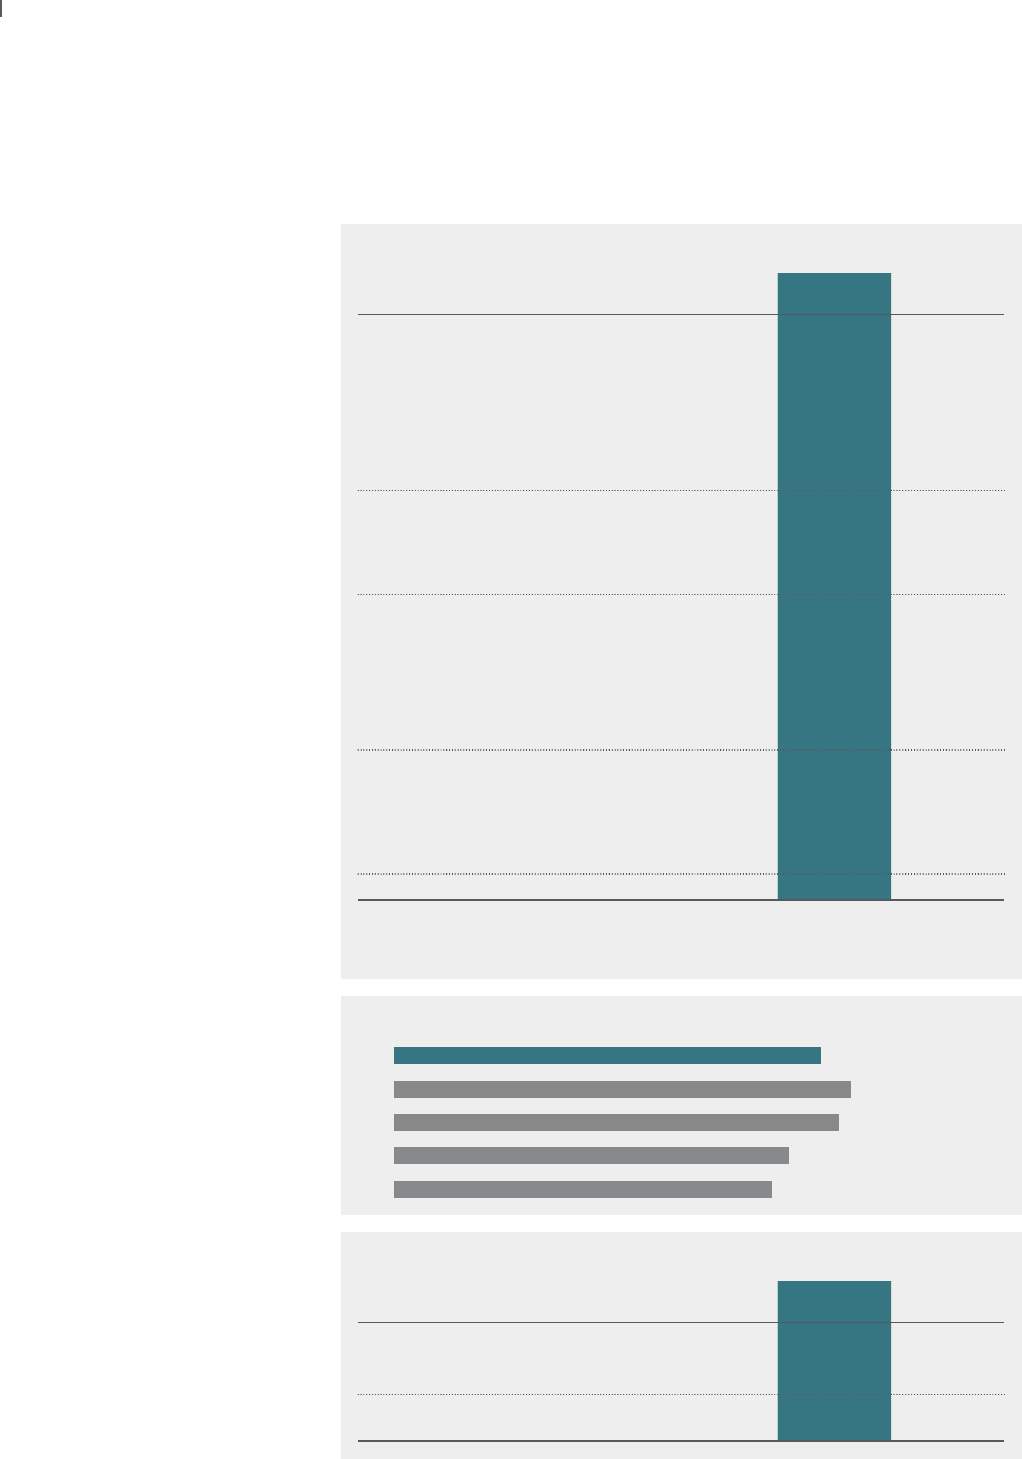
As shown in the Cash flow and net
debt summary table opposite, we
generated very strong operating and
free cash flows in the year. A five-year
summary showing the progression of
our operating cash flow performance is
shown in the chart below. The continued
strength of our operating cash flow
performance reflects the nature of our
business and financial model and our
focus on working capital management.
Net debt at 31 March 2016 was
US$3,023m (2015: US$3,217m), with
undrawn committed borrowing facilities
of US$2,175m (2015: US$2,085m). Our
net debt at 31 March 2016 was 1.9 times
EBITDA (2015: 1.9 times), compared to
the target range of 2.0 to 2.5 times that
we adopted last year. We did not breach
any covenants given on borrowings in
either the year under review or the prior
year and have no undue concentration
of repayment obligations in respect
of borrowings.
Acquisition expenditure has been
modest in both the current and prior
years and our capital expenditure
of US$339m (2015: US$380m) was
7.5% (2015: 7.9%) of total revenue. Net
capital expenditure was US$325m
(2015: US$376m).
Financial review continued
Cash flow and net debt summary
Year ended 31 March
2016
US$m
2015
US$m
Total EBIT 1,210 1,306
Amortisation and depreciation
charged to Benchmark PBT 353 384
Net capital expenditure (325) (376)
Increase in working capital (21) (1)
Profit retained in associates (1) (1)
Charge for share incentive plans 54 47
Operating cash flow 1,270 1,359
Net interest paid (66) (74)
Tax paid – continuing operations (136) (145)
Dividends paid to non-controlling interests (3) (5)
Free cash flow 1,065 1,135
Acquisitions (22) (67)
Purchase of investments (2) –
Disposal of businesses and investments 163 16
Exceptional items other than disposal of businesses (20) (12)
Ordinary dividends paid (380) (374)
Net cash inflow – continuing operations 804 698
Net debt at 1 April (3,217) (3,809)
Net share purchases (592) (192)
Exchange, discontinued operations
and other movements (18) 86
Net debt at 31 March (3,023) (3,217)
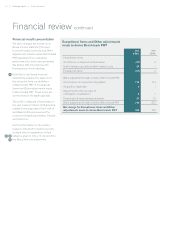
Total investment of US$347m (2015: US$443m) comprises cash flows for net capital expenditure
and acquisitions.
Operating cash flow (US$m) and cash flow conversion (%)
Reconciliation of net capital expenditure
Year ended 31 March
2016
US$m
2015
US$m
Capital expenditure as reported in the
Group cash flow statement 339 380
Disposal of property, plant and equipment (14) (4)
Net capital expenditure as reported
in the Cash flow and net debt summary 325 376
1,270 105%
104%
101%
94%
96%
1,321
1,359
1,175
1,124
2016
14
15
13
12
Strategic report •Financial review