Experian 2016 Annual Report Download - page 143
Download and view the complete annual report
Please find page 143 of the 2016 Experian annual report below. You can navigate through the pages in the report by either clicking on the pages listed below, or by using the keyword search tool below to find specific information within the annual report.-
 1
1 -
2
-
3
-
4
-
5
-
6
-
7
-
8
-
9
-
10
-
11
-
12
-
13
-
14
-
15
-
16
-
17
-
18
-
19
-
20
-
21
-
22
-
23
-
24
-
25
-
26
-
27
-
28
-
29
-
30
-
31
-
32
-
33
-
34
-
35
-
36
-
37
-
38
-
39
-
40
-
41
-
42
-
43
-
44
-
45
-
46
-
47
-
48
-
49
-
50
-
51
-
52
-
53
-
54
-
55
-
56
-
57
-
58
-
59
-
60
-
61
-
62
-
63
-
64
-
65
-
66
-
67
-
68
-
69
-
70
-
71
-
72
-
73
-
74
-
75
-
76
-
77
-
78
-
79
-
80
-
81
-
82
-
83
-
84
-
85
-
86
-
87
-
88
-
89
-
90
-
91
-
92
-
93
-
94
-
95
-
96
-
97
-
98
-
99
-
100
-
101
-
102
-
103
-
104
-
105
-
106
-
107
-
108
-
109
-
110
-
111
-
112
-
113
-
114
-
115
-
116
-
117
-
118
-
119
-
120
-
121
-
122
-
123
-
124
-
125
-
126
-
127
-
128
-
129
-
130
-
131
-
132
-
 133
133 -
 134
134 -
 135
135 -
 136
136 -
 137
137 -
 138
138 -
 139
139 -
 140
140 -
 141
141 -
 142
142 -
 143
143 -
 144
144 -
 145
145 -
 146
146 -
 147
147 -
 148
148 -
 149
149 -
 150
150 -
 151
151 -
 152
152 -
 153
153 -
154
-
155
-
156
-
157
-
158
-
159
-
160
-
161
-
162
-
163
-
164
-
165
-
166
-
167
-
168
-
169
-
170
-
171
-
172
-
173
-
174
-
175
-
176
-
177
-
178
-
179
-
180
-
181
-
182
-
183
-
184
-
185
-
186
-
187
-
188
 |
 |

141•Notes to the Group nancial statementsFinancial statements
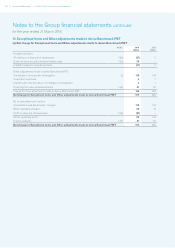
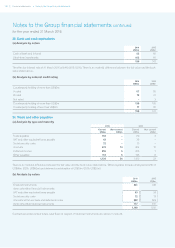
17. Earnings per share disclosures
(a) Earnings per share (‘EPS’)
Basic Diluted
2016
US cents
2015
US cents
2016
US cents
2015
US cents
Continuing and discontinued operations 78.6 79.0 78.1 78.1
Add/(deduct): discontinued operations 1.3 (2.1) 1.3 (2.1)
Continuing operations 79.9 76.9 79.4 76.0
(Deduct)/add: exceptional items, net of related tax (1.2) 0.2 (1.2) 0.2
Add: other adjustments made to derive Benchmark PBT, net of related tax 10.4 18.1 10.4 17.9
Benchmark earnings per share from continuing operations (non-GAAP measure) 89.1 95.2 88.6 94.1
(b) Analysis of earnings
(i) Attributable to owners of Experian plc
2016
US$m
2015
US$m
Continuing and discontinued operations 753 772
Add/(deduct): discontinued operations 12 (21)
Continuing operations 765 751
(Deduct)/add: exceptional items, net of related tax (11) 2
Add: other adjustments made to derive Benchmark PBT, net of related tax 100 177
Benchmark earnings attributable to owners of Experian plc (non-GAAP measure) 854 930
(ii) Attributable to non-controlling interests
2016
US$m
2015
US$m
Continuing and discontinued operations (1) –
Add: amortisation of acquisition intangibles attributable to non-controlling interests, net of related tax –1
Benchmark earnings attributable to non-controlling interests (non-GAAP measure) (1) 1
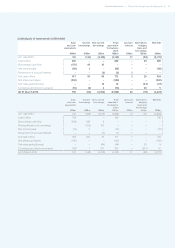
(c) Reconciliation of Total benchmark earnings to profit for the financial year
2016
US$m
2015
US$m
Total benchmark earnings (non-GAAP measure) 853 931
(Loss)/profit from discontinued operations (12) 21
Profit/(loss) from exceptional items, net of related tax 11 (2)
Loss from other adjustments made to derive Benchmark PBT, net of related tax (100) (178)
Profit for the financial year 752 772
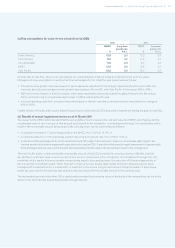
(d) Weighted average number of ordinary shares used
2016
million
2015
million
Weighted average number of ordinary shares 958 977
Add: dilutive effect of share incentive awards, options and share purchases 6 11
Diluted weighted average number of ordinary shares 964 988