Experian 2016 Annual Report Download - page 156
Download and view the complete annual report
Please find page 156 of the 2016 Experian annual report below. You can navigate through the pages in the report by either clicking on the pages listed below, or by using the keyword search tool below to find specific information within the annual report.-
 1
1 -
2
-
3
-
4
-
5
-
6
-
7
-
8
-
9
-
10
-
11
-
12
-
13
-
14
-
15
-
16
-
17
-
18
-
19
-
20
-
21
-
22
-
23
-
24
-
25
-
26
-
27
-
28
-
29
-
30
-
31
-
32
-
33
-
34
-
35
-
36
-
37
-
38
-
39
-
40
-
41
-
42
-
43
-
44
-
45
-
46
-
47
-
48
-
49
-
50
-
51
-
52
-
53
-
54
-
55
-
56
-
57
-
58
-
59
-
60
-
61
-
62
-
63
-
64
-
65
-
66
-
67
-
68
-
69
-
70
-
71
-
72
-
73
-
74
-
75
-
76
-
77
-
78
-
79
-
80
-
81
-
82
-
83
-
84
-
85
-
86
-
87
-
88
-
89
-
90
-
91
-
92
-
93
-
94
-
95
-
96
-
97
-
98
-
99
-
100
-
101
-
102
-
103
-
104
-
105
-
106
-
107
-
108
-
109
-
110
-
111
-
112
-
113
-
114
-
115
-
116
-
117
-
118
-
119
-
120
-
121
-
122
-
123
-
124
-
125
-
126
-
127
-
128
-
129
-
130
-
131
-
132
-
133
-
134
-
135
-
136
-
137
-
138
-
139
-
140
-
141
-
142
-
143
-
144
-
145
-
 146
146 -
 147
147 -
 148
148 -
 149
149 -
 150
150 -
 151
151 -
 152
152 -
 153
153 -
 154
154 -
 155
155 -
 156
156 -
 157
157 -
 158
158 -
 159
159 -
 160
160 -
 161
161 -
 162
162 -
 163
163 -
 164
164 -
 165
165 -
 166
166 -
167
-
168
-
169
-
170
-
171
-
172
-
173
-
174
-
175
-
176
-
177
-
178
-
179
-
180
-
181
-
182
-
183
-
184
-
185
-
186
-
187
-
188
 |
 |

154
Notes to the Group financial statements continued
for the year ended 31 March 2016
Financial statements •Notes to the Group nancial statements
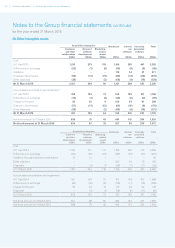
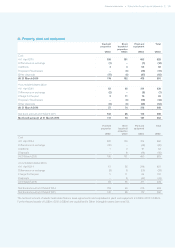
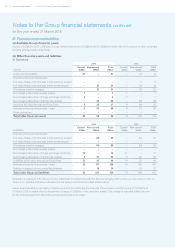
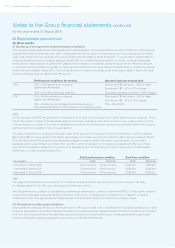
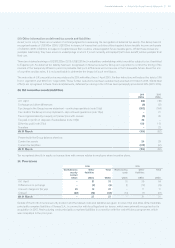
27. Financial assets and liabilities continued
(d) Analysis of movements in Level 3 assets/(liabilities)
Year ended 31 March 2016 Year ended 31 March 2015
Available-
for-sale
US$m
Contingent
consideration
US$m
Other
US$m
Total
US$m
Available-
for-sale
US$m
Contingent
consideration
US$m
Other
US$m
Total
US$m
At 1 April 5(11) (22) (28) 3(2) (44) (43)
Additions 2 – – 2 2(2) – –
Settlement of contingent
consideration – 2 – 2 – – – –
Adjustment to the fair value of
contingent consideration – 2 – 2 –(7) –(7)
Valuation gains recognised in
Group income statement – – 13 13 – – 1 1
Currency translation gains/(losses)
recognised directly in other
comprehensive income 1 – (1) –– – 5 5
Exercise of option in connection with
an acquisition – – – – – – 16 16
Other 2 – – 2 – – – –
At 31 March 10 (7) (10) (7) 5(11) (22) (28)
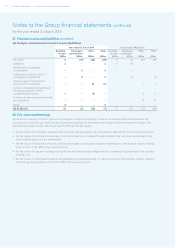
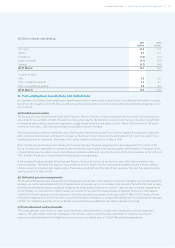
28. Fair value methodology
Information in respect of the fair value of borrowings is included in note 25(a). There are no material differences between the
carrying value of the Group’s other financial assets and liabilities not measured at fair value and their estimated fair values. The
following assumptions and methods are used to estimate the fair values:
• the fair values of receivables, payables and cash and cash equivalents are considered to approximate to the carrying amounts;
• the fair values of short-term borrowings, other than bonds, are considered to approximate to the carrying amounts due to the
short maturity terms of such instruments;
• the fair value of that portion of bonds carried at amortised cost is based on quoted market prices, employing a valuation falling
within Level 1 of the IFRS 13 fair value hierarchy;
• the fair values of long-term floating rate bank loans and finance lease obligations are considered to approximate to the carrying
amount; and
• the fair values of other financial assets and liabilities are calculated based on a discounted cash flow analysis, using a valuation
methodology falling within Level 2 of the IFRS 13 fair value hierarchy.