Experian 2016 Annual Report Download - page 40
Download and view the complete annual report
Please find page 40 of the 2016 Experian annual report below. You can navigate through the pages in the report by either clicking on the pages listed below, or by using the keyword search tool below to find specific information within the annual report.-
 1
1 -
2
-
3
-
4
-
5
-
6
-
7
-
8
-
9
-
10
-
11
-
12
-
13
-
14
-
15
-
16
-
17
-
18
-
19
-
20
-
21
-
22
-
23
-
24
-
25
-
26
-
27
-
28
-
29
-
 30
30 -
 31
31 -
 32
32 -
 33
33 -
 34
34 -
 35
35 -
 36
36 -
 37
37 -
 38
38 -
 39
39 -
 40
40 -
 41
41 -
 42
42 -
 43
43 -
 44
44 -
 45
45 -
 46
46 -
 47
47 -
 48
48 -
 49
49 -
 50
50 -
51
-
52
-
53
-
54
-
55
-
56
-
57
-
58
-
59
-
60
-
61
-
62
-
63
-
64
-
65
-
66
-
67
-
68
-
69
-
70
-
71
-
72
-
73
-
74
-
75
-
76
-
77
-
78
-
79
-
80
-
81
-
82
-
83
-
84
-
85
-
86
-
87
-
88
-
89
-
90
-
91
-
92
-
93
-
94
-
95
-
96
-
97
-
98
-
99
-
100
-
101
-
102
-
103
-
104
-
105
-
106
-
107
-
108
-
109
-
110
-
111
-
112
-
113
-
114
-
115
-
116
-
117
-
118
-
119
-
120
-
121
-
122
-
123
-
124
-
125
-
126
-
127
-
128
-
129
-
130
-
131
-
132
-
133
-
134
-
135
-
136
-
137
-
138
-
139
-
140
-
141
-
142
-
143
-
144
-
145
-
146
-
147
-
148
-
149
-
150
-
151
-
152
-
153
-
154
-
155
-
156
-
157
-
158
-
159
-
160
-
161
-
162
-
163
-
164
-
165
-
166
-
167
-
168
-
169
-
170
-
171
-
172
-
173
-
174
-
175
-
176
-
177
-
178
-
179
-
180
-
181
-
182
-
183
-
184
-
185
-
186
-
187
-
188
 |
 |

38
“ Experian reported improving underlying financial
performance during the year, with good growth
momentum, a 5% increase in Benchmark EPS at
constant currency and strong operating cash flow.”
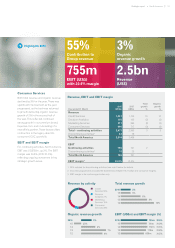
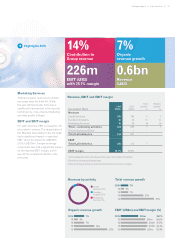
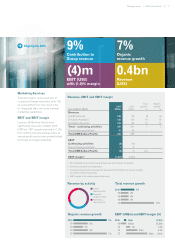
Summary
The Group made significant progress
during the year, with organic revenue
growth improving to an average of 5%
for the year as a whole. At constant
currency, EBIT margin was stable,
reflecting continued focus on efficiency
and investment in our strategic
growth initiatives.
The Group reports its financial results in
US dollars and therefore the weakness
of the Group’s other trading currencies
(primarily the Brazilian real) against the
US dollar during the year decreased our
total revenue by US$412m and Total EBIT
by US$137m, with an adverse impact on
EBIT margin of 60 basis points. Details
of the principal exchange rates used and
currency exposures are given in note 9 to
the Group financial statements.
Commentary on revenue and EBIT
performance by region is provided
earlier in the Strategic report, within the
Chief Executive’s and Regional reviews.
The table opposite summarises our
performance by business segment.
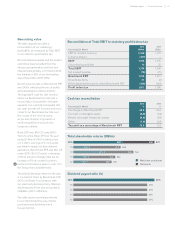
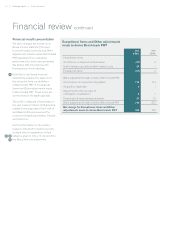
This review also includes a further
reconciliation of our underlying profitability
to our statutory profit before tax.
The Group reported Benchmark PBT
of US$1,136m (2015: US$1,231m).
Benchmark EPS of 89.1 US cents (2015:
95.2 US cents) represents an increase of
5% at constant currency and a reduction
of 6% at actual exchange rates. The
net interest expense of US$74m (2015:
US$75m) reflects the continuing
benefit of low US dollar interest rates,
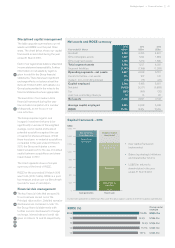
Key financials
Year ended 31 March 2016 2015
Revenue – continuing activities US$4,477m US$4,658m
Organic revenue growth* 5% 1%
Total EBIT* US$1,210m US$1,306m
EBIT growth at constant currency 5% 4%
Benchmark PBT US$1,136m US$1,231m
Benchmark EPS 89.1 USc 95.2 USc
Operating cash flow* US$1,270m US$1,359m
Cash flow conversion* 105% 104%
Net share purchases US$592m US$192m
ROCE* 15.4% 14.9%
* Financial key performance indicator (‘Financial KPI’)
89.1 40.00
95.2 39.25
91.7 37.50
2016 2016
15 15
14 14
85.2 34.75
13 13
78.9 32.00
12 12
Benchmark EPS (USc) Dividend per share (USc)
4,477
4,658
4,772
2016
15
14
4,582
13
4,456
12
Revenue (US$m) and
Organic revenue growth (%)
1,2105%
1,3061%
1,3065%
2016
15
14
1,2518% 13
1,17510% 12
Total EBIT (US$m)
and EBIT margin (%)
Financial performance reporting
Summaries of our key financial metrics are shown in the tables above, including five-year summaries
showing the progression of Revenue, Total EBIT and EBIT margin, Benchmark EPS and Dividend per share.
The Group has identified and defined certain non-GAAP measures, as they are the key measures used
within the business to assess performance. Details of all non-GAAP measures are given in note 6 to the
Group financial statements.
The Financial review reports underlying financial results excluding disposals, certain remeasurements and
impairments, as the exclusion of these items provides readers with a clear and consistent presentation of
the underlying operating performance of the Group’s ongoing business. These measures are used within
this Financial review and, unless otherwise indicated, all discussion of Revenue, EBIT and EBIT margin
relates to continuing activities only.
Financial review
26.7%
27.3%
27.4%
27.1%
26.2%
p134
p10
p26 p30
Introduction
Lloyd Pitchford Chief Financial Officer
Strategic report •Financial review