Experian 2016 Annual Report Download - page 42
Download and view the complete annual report
Please find page 42 of the 2016 Experian annual report below. You can navigate through the pages in the report by either clicking on the pages listed below, or by using the keyword search tool below to find specific information within the annual report.-
 1
1 -
2
-
3
-
4
-
5
-
6
-
7
-
8
-
9
-
10
-
11
-
12
-
13
-
14
-
15
-
16
-
17
-
18
-
19
-
20
-
21
-
22
-
23
-
24
-
25
-
26
-
27
-
28
-
29
-
30
-
31
-
 32
32 -
 33
33 -
 34
34 -
 35
35 -
 36
36 -
 37
37 -
 38
38 -
 39
39 -
 40
40 -
 41
41 -
 42
42 -
 43
43 -
 44
44 -
 45
45 -
 46
46 -
 47
47 -
 48
48 -
 49
49 -
 50
50 -
 51
51 -
 52
52 -
53
-
54
-
55
-
56
-
57
-
58
-
59
-
60
-
61
-
62
-
63
-
64
-
65
-
66
-
67
-
68
-
69
-
70
-
71
-
72
-
73
-
74
-
75
-
76
-
77
-
78
-
79
-
80
-
81
-
82
-
83
-
84
-
85
-
86
-
87
-
88
-
89
-
90
-
91
-
92
-
93
-
94
-
95
-
96
-
97
-
98
-
99
-
100
-
101
-
102
-
103
-
104
-
105
-
106
-
107
-
108
-
109
-
110
-
111
-
112
-
113
-
114
-
115
-
116
-
117
-
118
-
119
-
120
-
121
-
122
-
123
-
124
-
125
-
126
-
127
-
128
-
129
-
130
-
131
-
132
-
133
-
134
-
135
-
136
-
137
-
138
-
139
-
140
-
141
-
142
-
143
-
144
-
145
-
146
-
147
-
148
-
149
-
150
-
151
-
152
-
153
-
154
-
155
-
156
-
157
-
158
-
159
-
160
-
161
-
162
-
163
-
164
-
165
-
166
-
167
-
168
-
169
-
170
-
171
-
172
-
173
-
174
-
175
-
176
-
177
-
178
-
179
-
180
-
181
-
182
-
183
-
184
-
185
-
186
-
187
-
188
 |
 |
40
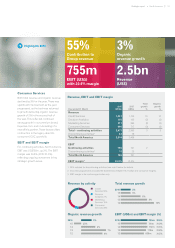
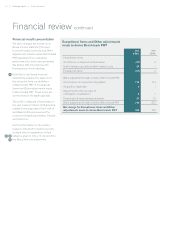
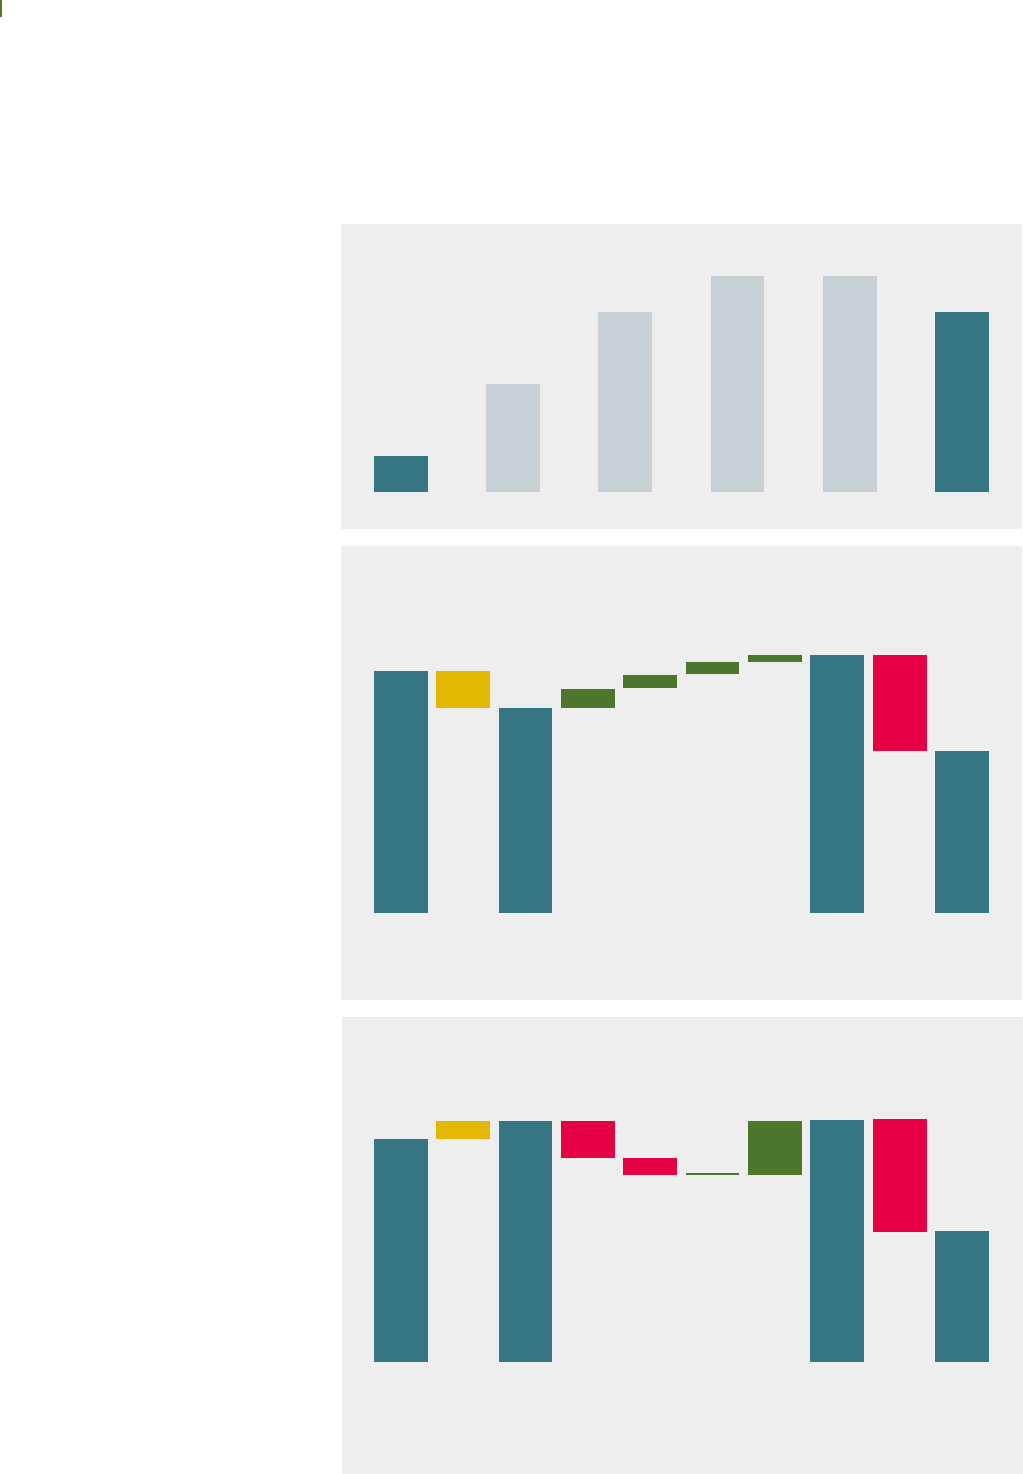
EBIT margin by region (%)
Continuing activities revenue (US$m)
Organic revenue growth trend (%)
Year 2016Q4 2016Q3 2016Q2 2016Q1 2016Year 2015
Growing the business
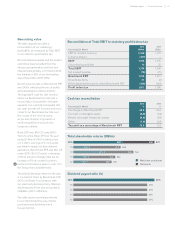
The Group delivered improving growth
momentum during the year, with organic
revenue growth returning to its mid
single-digit target range.
Total revenue growth from continuing
activities was 5% at constant exchange
rates in the year ended 31 March 2016,
with a reduction of 4% at actual rates.
The development of revenue from the
prior year is shown in the chart opposite.
Growth at constant currency was
balanced across all four regions.
This year, Total EBIT was US$1,210m,
down 7% at actual exchange rates
but up 3% at constant currency.
Expenditure through the income
statement in support of growth included
initiatives in key areas such as Brazil,
Health, Consumer Services and Credit
Services. We also invested in regulatory
and compliance expenditure, and
restructuring and productivity initiatives.
EBIT margin from continuing activities
was stable at constant currency. The
impact of foreign exchange movements
reduced EBIT margin by 60 basis points
overall for the year.
A reconciliation of the movement in
EBIT margin from continuing activities
between the prior and the current year
is shown in the chart opposite.
Financial review continued
(0.1)
0.3 27.3
(0.6)
26.7
EMEA/
Asia
Pacific
2016
reported
EBIT
margin
2016
(before
FX
impact)
Latin
America
Foreign
exchange
impact
2015
reported
EBIT
margin
27.2
4,810 (152)
4,658
3%
7%
5% 7%
5%
growth at
constant
exchange
rates
(4%)
decline
at actual
rates
(7%)
27.3
2015
restated
EBIT
margin
(0.2)
North
America
0.1
Disposals UK and
Ireland
2015
reported
revenue
2016
reported
revenue
2016
(before
FX
impact)
Foreign
exchange
impact
Disposals 2015
restated
revenue
North
America
Latin
America
UK and
Ireland
EMEA/
Asia
Pacific
3%
6%
5%
6%
5%
1%
Strategic report •Financial review