Experian 2016 Annual Report Download - page 45
Download and view the complete annual report
Please find page 45 of the 2016 Experian annual report below. You can navigate through the pages in the report by either clicking on the pages listed below, or by using the keyword search tool below to find specific information within the annual report.-
 1
1 -
2
-
3
-
4
-
5
-
6
-
7
-
8
-
9
-
10
-
11
-
12
-
13
-
14
-
15
-
16
-
17
-
18
-
19
-
20
-
21
-
22
-
23
-
24
-
25
-
26
-
27
-
28
-
29
-
30
-
31
-
32
-
33
-
34
-
 35
35 -
 36
36 -
 37
37 -
 38
38 -
 39
39 -
 40
40 -
 41
41 -
 42
42 -
 43
43 -
 44
44 -
 45
45 -
 46
46 -
 47
47 -
 48
48 -
 49
49 -
 50
50 -
 51
51 -
 52
52 -
 53
53 -
 54
54 -
 55
55 -
56
-
57
-
58
-
59
-
60
-
61
-
62
-
63
-
64
-
65
-
66
-
67
-
68
-
69
-
70
-
71
-
72
-
73
-
74
-
75
-
76
-
77
-
78
-
79
-
80
-
81
-
82
-
83
-
84
-
85
-
86
-
87
-
88
-
89
-
90
-
91
-
92
-
93
-
94
-
95
-
96
-
97
-
98
-
99
-
100
-
101
-
102
-
103
-
104
-
105
-
106
-
107
-
108
-
109
-
110
-
111
-
112
-
113
-
114
-
115
-
116
-
117
-
118
-
119
-
120
-
121
-
122
-
123
-
124
-
125
-
126
-
127
-
128
-
129
-
130
-
131
-
132
-
133
-
134
-
135
-
136
-
137
-
138
-
139
-
140
-
141
-
142
-
143
-
144
-
145
-
146
-
147
-
148
-
149
-
150
-
151
-
152
-
153
-
154
-
155
-
156
-
157
-
158
-
159
-
160
-
161
-
162
-
163
-
164
-
165
-
166
-
167
-
168
-
169
-
170
-
171
-
172
-
173
-
174
-
175
-
176
-
177
-
178
-
179
-
180
-
181
-
182
-
183
-
184
-
185
-
186
-
187
-
188
 |
 |

43
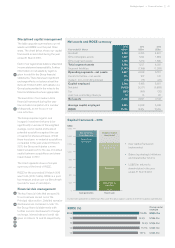
Disciplined capital management
The table opposite summarises our net
assets and ROCE over the past three
years. The chart below shows our capital
framework as executed during the year
ended 31 March 2016.
Each of our regions has balance sheet and
income statement responsibility. Further
information on net assets by region is
given in note 8 to the Group financial
statements. There have been significant
exchange effects on balance sheet line
items at 31 March 2016, with details on a
Group basis provided in the notes to the
financial statements where appropriate.
The execution of our medium-term
financial framework during the year
has included completion of a number
of disposals, as we focus on our
core activities.
The Group requires organic and
inorganic investment returns to be
significantly in excess of the weighted
average cost of capital and tests all
potential acquisitions against the use
of capital for share purchases. Whilst
there have been no material acquisitions
completed in the year ended 31 March
2016, the Group anticipates a more
balanced approach to the use of residual
capital between acquisitions and share
repurchases in 2017.
The chart opposite shows a five-year
summary of the trend of ROCE.
ROCE for the year ended 31 March 2016
was 15.4% (2015: 14.9%). ROCE is a post-
tax measure and we use our Benchmark
tax rate for ease of calculation.
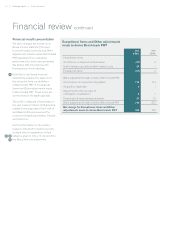
Financial risk management
The key financial risks that are specific
to our business are set out in the
Principal risks section. Detailed narrative
disclosures are contained in note 7 to
the Group financial statements with
further numeric disclosures for foreign
exchange, interest rate and credit risk
given in notes 9, 14 and 23 respectively.
Net assets and ROCE summary
Year ended 31 March
2016
US$m
2015
US$m
2014
US$m
Goodwill 4,198 4,393 4,807
Other intangible assets 1,431 1,624 1,869
Other segment assets 1,165 1,210 1,380
Total segment assets 6,794 7,227 8,056
Segment liabilities (1,147) (1,188) (1,289)
Operating segments – net assets 5,647 6,039 6,767
Central Activities – net assets 111 162 176
Deduct: non-controlling interest (14) (15) (22)
Capital employed 5,744 6,18 6 6,921
Net debt (3,023) (3,217) (3,809)
Tax (297) (183) (30)
Add: non-controlling interests 14 15 22
Net assets 2,438 2,801 3,104
Average capital employed 5,921 6,638 6,098
ROCE 15.4% 14.9% 15.6%
Capital framework – 2016
ROCE (%)
15.4% US$5.7bn
15.6% US$6.9bn
14.9% US$6.2bn
Closing capital
employed
15.5% US$5.7bn
15.1% US$6.0bn
1,600
US$m
1,400
1,000
600
200
1,200
800
400
0
Use of cashCash generation
Net proceeds
from disposals
Organic capital
investment
Share repurchase
programme
Dividends
Reduction in
net debt
Other
Funds from
operations
• New capital framework
implemented
• Balancing strategic initiatives
and shareholder returns
• US$972m returns to
shareholders in the year
ended 31 March 2016
Funds from operations is defined as free cash flow plus organic capital investment (capital expenditure).
2016
14
15
13
12
p131
p137
p18
p128
p148
p138
p134
Strategic report •Financial review