Experian 2016 Annual Report Download - page 86
Download and view the complete annual report
Please find page 86 of the 2016 Experian annual report below. You can navigate through the pages in the report by either clicking on the pages listed below, or by using the keyword search tool below to find specific information within the annual report.-
 1
1 -
2
-
3
-
4
-
5
-
6
-
7
-
8
-
9
-
10
-
11
-
12
-
13
-
14
-
15
-
16
-
17
-
18
-
19
-
20
-
21
-
22
-
23
-
24
-
25
-
26
-
27
-
28
-
29
-
30
-
31
-
32
-
33
-
34
-
35
-
36
-
37
-
38
-
39
-
40
-
41
-
42
-
43
-
44
-
45
-
46
-
47
-
48
-
49
-
50
-
51
-
52
-
53
-
54
-
55
-
56
-
57
-
58
-
59
-
60
-
61
-
62
-
63
-
64
-
65
-
66
-
67
-
68
-
69
-
70
-
71
-
72
-
73
-
74
-
75
-
 76
76 -
 77
77 -
 78
78 -
 79
79 -
 80
80 -
 81
81 -
 82
82 -
 83
83 -
 84
84 -
 85
85 -
 86
86 -
 87
87 -
 88
88 -
 89
89 -
 90
90 -
 91
91 -
 92
92 -
 93
93 -
 94
94 -
 95
95 -
 96
96 -
97
-
98
-
99
-
100
-
101
-
102
-
103
-
104
-
105
-
106
-
107
-
108
-
109
-
110
-
111
-
112
-
113
-
114
-
115
-
116
-
117
-
118
-
119
-
120
-
121
-
122
-
123
-
124
-
125
-
126
-
127
-
128
-
129
-
130
-
131
-
132
-
133
-
134
-
135
-
136
-
137
-
138
-
139
-
140
-
141
-
142
-
143
-
144
-
145
-
146
-
147
-
148
-
149
-
150
-
151
-
152
-
153
-
154
-
155
-
156
-
157
-
158
-
159
-
160
-
161
-
162
-
163
-
164
-
165
-
166
-
167
-
168
-
169
-
170
-
171
-
172
-
173
-
174
-
175
-
176
-
177
-
178
-
179
-
180
-
181
-
182
-
183
-
184
-
185
-
186
-
187
-
188
 |
 |

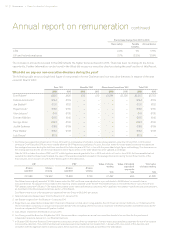
Remuneration at a glance
Arrangements for the coming year
Opportunity: 100% of salary at target
and 200% of salary at maximum performance
Performance metrics: Benchmark PBT
growth of the business
Deferral: Between 50% and 100% of bonus
may be deferred into the CIP
How did we perform in the year?
Financial
performance
Cash flow
conversion
105%
Return on
capital employed
15.4%
Organic revenue
growth
5%
Returns to
shareholders
US$972m
of bonus will
be voluntarily
deferred into
Experian shares
for three years
(CEO: £1.75m)
100%
of all vested shares
from CIP or PSP are
required to be retained
until shareholder
guidelines are met
At least
50%
Shareholding
guidelines:
300% of salary for CEO;
200% of salary for other
executive directors
Ensuring shareholder alignment
1,270
1,359
1,321
2016
15
14
1,175
13
1,124
12
Operating cash flow (US$m)
15.4%
14.9%
15.6%
2016
15
14
15.5%13
15.1%
12
Return on capital employed
£0
£100
£200
2011 2012 2013 2014 2015 2016
Total shareholder return Experian FTSE 100
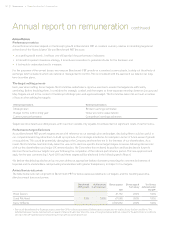
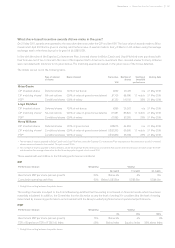
How was our performance reflected
in our pay?
Outcomes against performance
metrics for the year:
Brian Cassin
£’000
Lloyd Pitchford
£’000
Kerry Williams
US$’000
Salary 875 540 924
Benefits 18 19 29
Pension 175 108 12
Annual bonus 1,750 1,080 1,850
Share-based incentives 774 784 1,011
Total 3,592 2,531 3,826
Bonus
Increases of between 2.7% and 2.9% for
executive directors
Salary
Opportunity: Matching awards of up to 2:1
Performance metrics: Benchmark PBT per share
(50%) and Cumulative operating cash flow (50%)
CIP
Opportunity: Up to 200% of salary
Performance metrics: Benchmark PBT per share
(75%) and TSR relative to the FTSE 100 Index (25%)
PSP
Applied to all variable incentive awards made in
the year
Clawback
and malus
Annual Benchmark
PBT growth*:
*At constant currency
3-year average
Benchmark PBT growth*:
3-year Cumulative
operating cash flow*:
3-year Total
shareholder return:
5.3%
6.3%
US$4.3bn
Outperformed the
FTSE 100 by 6.8%
84 Governance •Report on directors’ remuneration