Experian 2016 Annual Report Download - page 91
Download and view the complete annual report
Please find page 91 of the 2016 Experian annual report below. You can navigate through the pages in the report by either clicking on the pages listed below, or by using the keyword search tool below to find specific information within the annual report.-
 1
1 -
2
-
3
-
4
-
5
-
6
-
7
-
8
-
9
-
10
-
11
-
12
-
13
-
14
-
15
-
16
-
17
-
18
-
19
-
20
-
21
-
22
-
23
-
24
-
25
-
26
-
27
-
28
-
29
-
30
-
31
-
32
-
33
-
34
-
35
-
36
-
37
-
38
-
39
-
40
-
41
-
42
-
43
-
44
-
45
-
46
-
47
-
48
-
49
-
50
-
51
-
52
-
53
-
54
-
55
-
56
-
57
-
58
-
59
-
60
-
61
-
62
-
63
-
64
-
65
-
66
-
67
-
68
-
69
-
70
-
71
-
72
-
73
-
74
-
75
-
76
-
77
-
78
-
79
-
80
-
 81
81 -
 82
82 -
 83
83 -
 84
84 -
 85
85 -
 86
86 -
 87
87 -
 88
88 -
 89
89 -
 90
90 -
 91
91 -
 92
92 -
 93
93 -
 94
94 -
 95
95 -
 96
96 -
 97
97 -
 98
98 -
 99
99 -
 100
100 -
 101
101 -
102
-
103
-
104
-
105
-
106
-
107
-
108
-
109
-
110
-
111
-
112
-
113
-
114
-
115
-
116
-
117
-
118
-
119
-
120
-
121
-
122
-
123
-
124
-
125
-
126
-
127
-
128
-
129
-
130
-
131
-
132
-
133
-
134
-
135
-
136
-
137
-
138
-
139
-
140
-
141
-
142
-
143
-
144
-
145
-
146
-
147
-
148
-
149
-
150
-
151
-
152
-
153
-
154
-
155
-
156
-
157
-
158
-
159
-
160
-
161
-
162
-
163
-
164
-
165
-
166
-
167
-
168
-
169
-
170
-
171
-
172
-
173
-
174
-
175
-
176
-
177
-
178
-
179
-
180
-
181
-
182
-
183
-
184
-
185
-
186
-
187
-
188
 |
 |

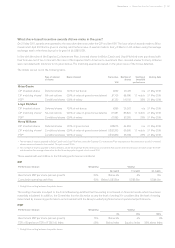
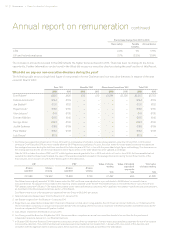
What share-based incentive awards did we make in the year?
On 21 May 2015, awards were granted to the executive directors under the CIP and the PSP. The face value of awards made to Brian
Cassin and Lloyd Pitchford is given in sterling, and the face value of awards made to Kerry Williams in US dollars, using the average
exchange rate for the three days prior to grant of £1:US$1.5561.
In line with the rules of the Experian Co-investment Plan, invested shares for Brian Cassin and Lloyd Pitchford were purchased with
their bonuses net of tax. In line with the rules of the Experian North America Co-investment Plan, invested shares for Kerry Williams
were calculated with reference to his gross bonus. The matching awards are based on the gross value of the bonus deferred.
The details are set out in the following table.
Type of interest
in shares
Basis of award Face value
’000
Number of
shares
Vesting at
threshold
performance
Vesting date
Brian Cassin
CIP invested shares Deferred shares 100% of net bonus £292 23,478 n/a 21 May 2018
CIP matching shares1Nil-cost options 200% of value of gross bonus deferral £1,103 88,596 1:1 match 21 May 2018
PSP2Conditional shares 200% of salary £1,750 141,015 25% 21 May 2018
Lloyd Pitchford
CIP invested shares Deferred shares 100% of net bonus £286 23,007 n/a 21 May 2018
CIP matching shares1Nil-cost options 200% of value of gross bonus deferral £1,081 86,820 1:1 match 21 May 2018
PSP2Conditional shares 200% of salary £1,080 87,026 25% 21 May 2018
Kerry Williams
CIP invested shares Deferred shares 100% of gross bonus US$675 34,953 n/a 21 May 2018
CIP matching shares2Conditional shares 200% of value of gross bonus deferral US$1,350 69,906 1:1 match 21 May 2018
PSP2Conditional shares 200% of salary US$1,850 95,799 25% 21 May 2018
1 The number of shares awarded to Brian Cassin and Lloyd Pitchford under the Experian Co-investment Plan was based on the share price at which invested
shares were purchased in the market. This price was £12.45.
2 The number of shares awarded to Kerry Williams under the Experian North America Co-investment Plan and to all three executive directors under the PSP
was based on the average share price for the three days prior to grant, which was £12.41.
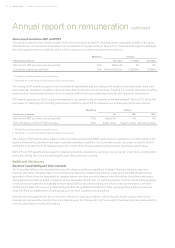
These awards will vest relative to the following performance conditions:
CIP
Performance measure Weighting Vesting1
No match 1:1 match 2:1 match
Benchmark PBT per share (annual growth) 50% Below 4% 4% 8%
Cumulative operating cash flow 50% Below US$3.6bn US$3.6bn US$4.0bn
1 Straight-line vesting between the points shown.
The vesting of awards is subject to the Committee being satisfied that the vesting is not based on financial results which have been
materially misstated. In addition, the Committee has the discretion to vary the level of vesting if it considers that the level of vesting
determined by measuring performance is inconsistent with the Group’s underlying financial and operational performance.
PSP
Performance measure Weighting Vesting1
0% 25% 100%
Benchmark PBT per share (annual growth) 75% Below 4% 4% 8%
TSR of Experian vs TSR of FTSE 100 Index 25% Below Index Equal to Index 25% above Index
1 Straight-line vesting between the points shown.
89Governance •Report on directors’ remuneration