Experian 2016 Annual Report Download - page 166
Download and view the complete annual report
Please find page 166 of the 2016 Experian annual report below. You can navigate through the pages in the report by either clicking on the pages listed below, or by using the keyword search tool below to find specific information within the annual report.-
 1
1 -
2
-
3
-
4
-
5
-
6
-
7
-
8
-
9
-
10
-
11
-
12
-
13
-
14
-
15
-
16
-
17
-
18
-
19
-
20
-
21
-
22
-
23
-
24
-
25
-
26
-
27
-
28
-
29
-
30
-
31
-
32
-
33
-
34
-
35
-
36
-
37
-
38
-
39
-
40
-
41
-
42
-
43
-
44
-
45
-
46
-
47
-
48
-
49
-
50
-
51
-
52
-
53
-
54
-
55
-
56
-
57
-
58
-
59
-
60
-
61
-
62
-
63
-
64
-
65
-
66
-
67
-
68
-
69
-
70
-
71
-
72
-
73
-
74
-
75
-
76
-
77
-
78
-
79
-
80
-
81
-
82
-
83
-
84
-
85
-
86
-
87
-
88
-
89
-
90
-
91
-
92
-
93
-
94
-
95
-
96
-
97
-
98
-
99
-
100
-
101
-
102
-
103
-
104
-
105
-
106
-
107
-
108
-
109
-
110
-
111
-
112
-
113
-
114
-
115
-
116
-
117
-
118
-
119
-
120
-
121
-
122
-
123
-
124
-
125
-
126
-
127
-
128
-
129
-
130
-
131
-
132
-
133
-
134
-
135
-
136
-
137
-
138
-
139
-
140
-
141
-
142
-
143
-
144
-
145
-
146
-
147
-
148
-
149
-
150
-
151
-
152
-
153
-
154
-
155
-
 156
156 -
 157
157 -
 158
158 -
 159
159 -
 160
160 -
 161
161 -
 162
162 -
 163
163 -
 164
164 -
 165
165 -
 166
166 -
 167
167 -
 168
168 -
 169
169 -
 170
170 -
 171
171 -
 172
172 -
 173
173 -
 174
174 -
 175
175 -
 176
176 -
177
-
178
-
179
-
180
-
181
-
182
-
183
-
184
-
185
-
186
-
187
-
188
 |
 |

164
Notes to the Group financial statements continued
for the year ended 31 March 2016
Financial statements •Notes to the Group nancial statements
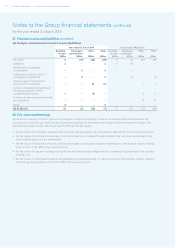
35. Called up share capital and share premium account
At 31 March 2016, there were 1,023.0m shares in issue (2015: 1,032.8m). During the year then ended 1.0m (2015: 1.2m) shares were
issued and 10.8m shares (2015: nil) were cancelled. Further information on share capital is contained in note P to the Company
financial statements.
The difference between the amounts shown in the Group and Company financial statements in respect of called up share capital
and the share premium account arose due to translation of sterling amounts into US dollars at different exchange rates on different
translation dates.
36. Retained earnings and other reserves
(a) Retained earnings
Retained earnings comprise net profits retained in the Group after the payment of equity dividends. There are no significant
statutory, contractual or exchange control restrictions on distributions by Group undertakings.
(b) Other reserves
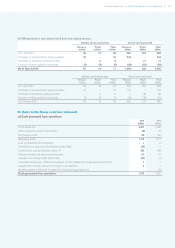
(i) Movements in reserves
Merger
reserve
US$m
Hedging
reserve
US$m
Translation
reserve
US$m
Own
shares
reserve
US$m
Total
other
reserves
US$m
At 1 April 2015 (15,682) 11 (770) (905) (17,346)
Purchase of shares held as treasury shares – – – (344) (344)
Purchase of shares by employee trusts – – – (71) (71)
Exercise of share awards and options – – – 80 80
Currency translation losses – – (149) – (149)
At 31 March 2016 (15,682) 11 (919) (1,240) (17,830)
Merger
reserve
US$m
Hedging
reserve
US$m
Translation
reserve
US$m
Own
shares
reserve
US$m
Total
other
reserves
US$m
At 1 April 2014 (15,682) 11 (200) (809) (16,680)
Purchase of shares held as treasury shares – – – (170) (170)
Purchase of shares by employee trusts – – – (38) (38)
Exercise of share awards and options – – – 112 112
Currency translation losses – – (570) – (570)
At 31 March 2015 (15,682) 11 (770) (905) (17,3 46)
(ii) Nature of reserves
The merger reserve arose on the demerger in October 2006 and is the difference between the share capital and share premium of
GUS plc and the nominal value of the share capital of the Company before a share offer at that date.
Movements on the hedging reserve and the position at the balance sheet date reflect hedging transactions which are not charged or
credited to the Group income statement, net of related tax.
Movements on the translation reserve and the position at the balance sheet date reflect foreign currency translations since 1 April 2004
which are not charged or credited to the Group income statement, net of related tax. The movement in the year ended 31 March 2016
comprises currency translation losses of US$151m (2015: US$570m) recognised directly in other comprehensive income, together with
the reclassification of cumulative currency translation gains in respect of divestments of US$2m (2015: US$nil).
The balance on the own shares reserve is the cost of ordinary shares in the Company and further details are given in note 36(b)(iii).
The difference between the amounts shown in the Group and Company financial statements in respect of this reserve arose due to
translation of sterling amounts into US dollars at different exchange rates on different translation dates.