Experian 2016 Annual Report Download - page 153
Download and view the complete annual report
Please find page 153 of the 2016 Experian annual report below. You can navigate through the pages in the report by either clicking on the pages listed below, or by using the keyword search tool below to find specific information within the annual report.-
 1
1 -
2
-
3
-
4
-
5
-
6
-
7
-
8
-
9
-
10
-
11
-
12
-
13
-
14
-
15
-
16
-
17
-
18
-
19
-
20
-
21
-
22
-
23
-
24
-
25
-
26
-
27
-
28
-
29
-
30
-
31
-
32
-
33
-
34
-
35
-
36
-
37
-
38
-
39
-
40
-
41
-
42
-
43
-
44
-
45
-
46
-
47
-
48
-
49
-
50
-
51
-
52
-
53
-
54
-
55
-
56
-
57
-
58
-
59
-
60
-
61
-
62
-
63
-
64
-
65
-
66
-
67
-
68
-
69
-
70
-
71
-
72
-
73
-
74
-
75
-
76
-
77
-
78
-
79
-
80
-
81
-
82
-
83
-
84
-
85
-
86
-
87
-
88
-
89
-
90
-
91
-
92
-
93
-
94
-
95
-
96
-
97
-
98
-
99
-
100
-
101
-
102
-
103
-
104
-
105
-
106
-
107
-
108
-
109
-
110
-
111
-
112
-
113
-
114
-
115
-
116
-
117
-
118
-
119
-
120
-
121
-
122
-
123
-
124
-
125
-
126
-
127
-
128
-
129
-
130
-
131
-
132
-
133
-
134
-
135
-
136
-
137
-
138
-
139
-
140
-
141
-
142
-
 143
143 -
 144
144 -
 145
145 -
 146
146 -
 147
147 -
 148
148 -
 149
149 -
 150
150 -
 151
151 -
 152
152 -
 153
153 -
 154
154 -
 155
155 -
 156
156 -
 157
157 -
 158
158 -
 159
159 -
 160
160 -
 161
161 -
 162
162 -
 163
163 -
164
-
165
-
166
-
167
-
168
-
169
-
170
-
171
-
172
-
173
-
174
-
175
-
176
-
177
-
178
-
179
-
180
-
181
-
182
-
183
-
184
-
185
-
186
-
187
-
188
 |
 |

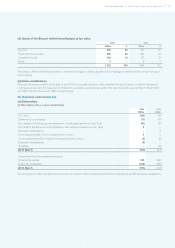
151•Notes to the Group nancial statementsFinancial statements
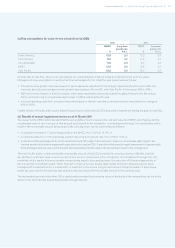
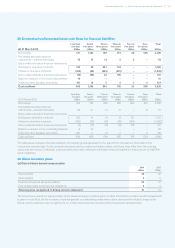
(c) Analysis of movements in Net debt
Cash
and cash
equivalents
US$m
Current
borrowings
US$m
Non-current
borrowings
US$m
Total
reported in
the balance
sheet
US$m
Accrued
interest
US$m
Derivatives
hedging
loans and
borrowings
US$m
Net debt
US$m
At 1 April 2015 147 (146) (3,146) (3,145) 17 (89) (3,217)
Cash inflow 840 – – 840 – 29 869
Borrowings cash flow (157) 96 61 – – – –
Net interest paid (66) 1 – (65) – – (65)
Movement on accrued interest – – (3) (3) 3 – –
Net cash inflow 617 97 58 772 3 29 804
Net share purchases (592) – – (592) – – (592)
Fair value gains/(losses) – – 16 16 – (43) (27)
Exchange and other movements (16) (3) 4(15) – 24 9
At 31 March 2016 156 (52) (3,068) (2,964) 20 (79) (3,023)
Cash
and cash
equivalents
US$m
Current
borrowings
US$m
Non-current
borrowings
US$m
Total
reported in
the balance
sheet
US$m
Accrued
interest
US$m
Derivatives
hedging
loans and
borrowings
US$m
Net debt
US$m
At 1 April 2014 212 (584) (3,576) (3,948) 10 129 (3,809)
Cash inflow 796 – – 796 – – 796
Borrowings cash flow (539) 535 4 – – – –
Reclassification of borrowings – (100) 100 – – – –
Net interest paid (74) 2 – (72) – – (72)
Movement on accrued interest – – (7) (7) 7 – –
Net cash inflow 183 437 97 717 7 – 724
Net share purchases (192) – – (192) – – (192)
Fair value gains/(losses) – – (44) (44) – 53 9
Exchange and other movements (56) 1 377 322 – (271) 51
At 31 March 2015 147 (146) (3,146) (3,145) 17 (89) (3,217)