Experian 2016 Annual Report Download - page 13
Download and view the complete annual report
Please find page 13 of the 2016 Experian annual report below. You can navigate through the pages in the report by either clicking on the pages listed below, or by using the keyword search tool below to find specific information within the annual report.-
 1
1 -
2
-
 3
3 -
 4
4 -
 5
5 -
 6
6 -
 7
7 -
 8
8 -
 9
9 -
 10
10 -
 11
11 -
 12
12 -
 13
13 -
 14
14 -
 15
15 -
 16
16 -
 17
17 -
 18
18 -
 19
19 -
 20
20 -
 21
21 -
 22
22 -
 23
23 -
24
-
25
-
26
-
27
-
28
-
29
-
30
-
31
-
32
-
33
-
34
-
35
-
36
-
37
-
38
-
39
-
40
-
41
-
42
-
43
-
44
-
45
-
46
-
47
-
48
-
49
-
50
-
51
-
52
-
53
-
54
-
55
-
56
-
57
-
58
-
59
-
60
-
61
-
62
-
63
-
64
-
65
-
66
-
67
-
68
-
69
-
70
-
71
-
72
-
73
-
74
-
75
-
76
-
77
-
78
-
79
-
80
-
81
-
82
-
83
-
84
-
85
-
86
-
87
-
88
-
89
-
90
-
91
-
92
-
93
-
94
-
95
-
96
-
97
-
98
-
99
-
100
-
101
-
102
-
103
-
104
-
105
-
106
-
107
-
108
-
109
-
110
-
111
-
112
-
113
-
114
-
115
-
116
-
117
-
118
-
119
-
120
-
121
-
122
-
123
-
124
-
125
-
126
-
127
-
128
-
129
-
130
-
131
-
132
-
133
-
134
-
135
-
136
-
137
-
138
-
139
-
140
-
141
-
142
-
143
-
144
-
145
-
146
-
147
-
148
-
149
-
150
-
151
-
152
-
153
-
154
-
155
-
156
-
157
-
158
-
159
-
160
-
161
-
162
-
163
-
164
-
165
-
166
-
167
-
168
-
169
-
170
-
171
-
172
-
173
-
174
-
175
-
176
-
177
-
178
-
179
-
180
-
181
-
182
-
183
-
184
-
185
-
186
-
187
-
188
 |
 |
11
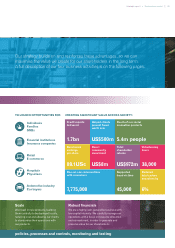
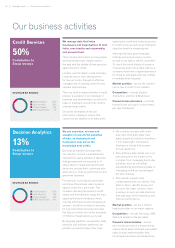
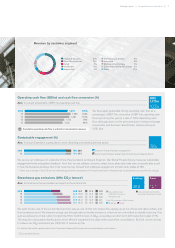
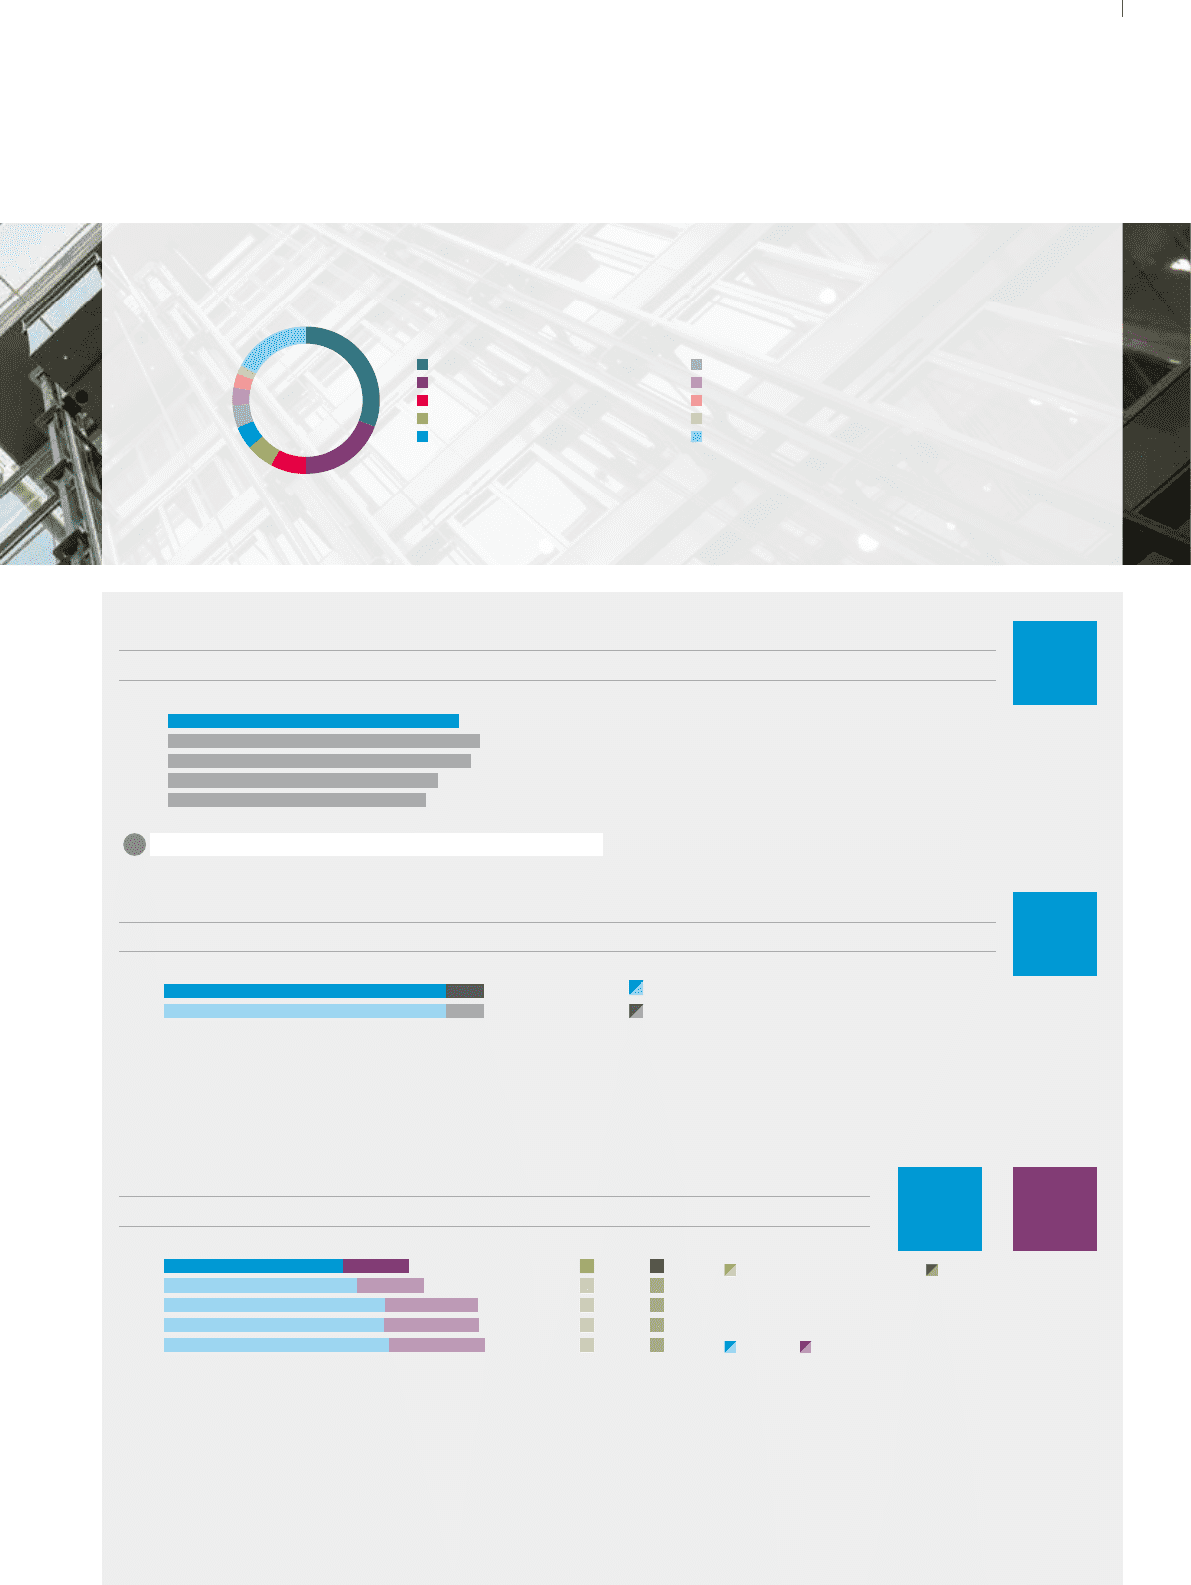
Revenue by customer segment
79% 86%
Experian Group employee engagement
Willis Towers Watson Global High Performing Companies Norm¹
We survey our employees to understand how they feel about working at Experian. Our Global People Survey measures sustainable
engagement levels and gathers feedback. From this, we can address concerns, shape future plans and make sure our people play a part
in how the business develops. Our most recent survey showed that employee engagement remains fairly stable at 78%.
1 There was a change in the 2015 survey methodology, and the comparative 2014 results have been retrospectively recalculated to account for this change.
Sustainable engagement (%)
Aim: To ensure Experian is a great place to work, attracting and retaining the best people
78% 86%2015
14
We have again generated strong operating cash flow as a
percentage of EBIT. The conversion of EBIT into operating cash
flow was strong this year at a rate of 105%. Operating cash
flow, although down on the prior year due to foreign exchange
movements and business divestments, remains strong at
US$1.3bn.
Operating cash flow (US$m) and cash flow conversion (%)
Aim: To convert at least 90% of EBIT into operating cash flow
Cumulative operating cash flow is a directors’ remuneration measure
1,270 105%2016
15
13
14
12
1,175 94%
1,321 101%
1,124 96%
1,359 104%
39.8 14.7 12.0 3.3
48.8 21.2 14.8 4.1
49.1 20.9 14.5 4.2
50.1 21.6 16.0 4.5
2016
15
13
14
12
We want to take care of the environment and one way we can do this is to reduce the energy use at our offices and data centres, and
from employee travel. We measure energy use through carbon dioxide emissions, which we are committed to steadily reducing. This
year we reduced our total carbon footprint by 6% to 54,503 tonnes of CO2e, exceeding our short-term 2016 reduction target of 5%.
The reduction was predominantly due to more efficient equipment at a data centre and office consolidation. By 2018, we are aiming
to reduce our CO2e emissions per US$1,000 of revenue by 5%.
For further information please refer to the Corporate Responsibility report at www.experianplc.com/crreport.
1 CO2 equivalent tonnes.
CO2e emission per
US$1,000 of revenue
(kilogrammes)
CO2e emission per full-time
equivalent employee (tonnes)
Total CO2e emission (000s tonnes):
Buildings Travel
Greenhouse gas emissions (000s CO2e tonnes¹)
Aim: To minimise as far as possible our impact on the environment
42.9 15.0 12.0 3.5
105%
US$
1,270m
78%
14.7
Travel
39.8
Buildings
p89
Financial services 31%
Direct-to-consumer 19%
Retail 8%
Healthcare 6%
Automotive 5%
Telecoms and utilities 5%
Insurance 4%
Media and technology 3%
Government and public sector 2%
Other 17%
Strategic report •Key performance indicators