Experian 2016 Annual Report Download - page 135
Download and view the complete annual report
Please find page 135 of the 2016 Experian annual report below. You can navigate through the pages in the report by either clicking on the pages listed below, or by using the keyword search tool below to find specific information within the annual report.-
 1
1 -
2
-
3
-
4
-
5
-
6
-
7
-
8
-
9
-
10
-
11
-
12
-
13
-
14
-
15
-
16
-
17
-
18
-
19
-
20
-
21
-
22
-
23
-
24
-
25
-
26
-
27
-
28
-
29
-
30
-
31
-
32
-
33
-
34
-
35
-
36
-
37
-
38
-
39
-
40
-
41
-
42
-
43
-
44
-
45
-
46
-
47
-
48
-
49
-
50
-
51
-
52
-
53
-
54
-
55
-
56
-
57
-
58
-
59
-
60
-
61
-
62
-
63
-
64
-
65
-
66
-
67
-
68
-
69
-
70
-
71
-
72
-
73
-
74
-
75
-
76
-
77
-
78
-
79
-
80
-
81
-
82
-
83
-
84
-
85
-
86
-
87
-
88
-
89
-
90
-
91
-
92
-
93
-
94
-
95
-
96
-
97
-
98
-
99
-
100
-
101
-
102
-
103
-
104
-
105
-
106
-
107
-
108
-
109
-
110
-
111
-
112
-
113
-
114
-
115
-
116
-
117
-
118
-
119
-
120
-
121
-
122
-
123
-
124
-
 125
125 -
 126
126 -
 127
127 -
 128
128 -
 129
129 -
 130
130 -
 131
131 -
 132
132 -
 133
133 -
 134
134 -
 135
135 -
 136
136 -
 137
137 -
 138
138 -
 139
139 -
 140
140 -
 141
141 -
 142
142 -
 143
143 -
 144
144 -
 145
145 -
146
-
147
-
148
-
149
-
150
-
151
-
152
-
153
-
154
-
155
-
156
-
157
-
158
-
159
-
160
-
161
-
162
-
163
-
164
-
165
-
166
-
167
-
168
-
169
-
170
-
171
-
172
-
173
-
174
-
175
-
176
-
177
-
178
-
179
-
180
-
181
-
182
-
183
-
184
-
185
-
186
-
187
-
188
 |
 |

133•Notes to the Group nancial statementsFinancial statements
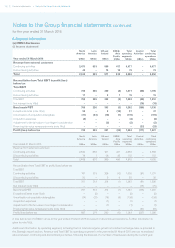
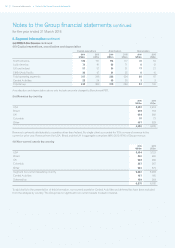
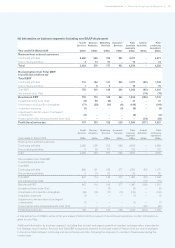
(b) Information on business segments (including non-GAAP disclosures)
Year ended 31 March 2016
Credit
Services
US$m
Decision
Analytics
US$m
Marketing
Services
US$m
Consumer
Services
US$m
Total
business
segments
US$m
Central
Activities
US$m
Total
continuing
operations
US$m
Revenue from external customers
Continuing activities 2,240 566 720 951 4,477 – 4,477
Discontinuing activities 3 13 57 – 73 – 73
Total 2,243 579 777 951 4,550 – 4,550
Reconciliation from Total EBIT
to profit/(loss) before tax
Total EBIT
Continuing activities 791 104 141 241 1,277 (82) 1,195
Discontinuing activities 1 6 8 – 15 – 15
Total EBIT 792 110 149 241 1,292 (82) 1,210
Net interest (note 14(b)) – – – – – (74) (74)
Benchmark PBT 792 110 149 241 1,292 (156) 1,136
Exceptional items (note 13(a)) (5) 48 (6) – 37 – 37
Amortisation of acquisition intangibles (77) (25) (11) (6) (119) – (119)
Acquisition expenses (1) – – (3) (4) – (4)
Adjustment to the fair value of contingent
consideration (2) – – – (2) – (2)
Financing fair value remeasurements (note 14(c)) – – – – – (21) (21)
Profit/(loss) before tax 707 133 132 232 1,204 (177) 1,027
Year ended 31 March 2015
Credit
Services
US$m
Decision
Analytics
US$m
Marketing
Services
US$m
Consumer
Services
US$m
Total
business
segments
US$m
Central
Activities
US$m
Total
continuing
operations
US$m
Revenue from external customers
Continuing activities 2,360 565 753 980 4,658 –4,658
Discontinuing activities 6 29 117 – 152 –152
Total 2,366 594 870 980 4,810 –4,810
Reconciliation from Total EBIT
to profit/(loss) before tax
Total EBIT
Continuing activities 845 101 129 277 1,352 (81) 1,271
Discontinuing activities 2 13 20 – 35 – 35
Total EBIT 847 114 149 277 1,387 (81) 1,306
Net interest (note 14(b)) – – – – – (75) (75)
Benchmark PBT 847 114 149 277 1,387 (156) 1,231
Exceptional items (note 13(a)) – – (2) –(2) –(2)
Amortisation of acquisition intangibles (90) (15) (17) (12) (134) –(134)
Acquisition expenses (1) – – – (1) –(1)
Adjustment to the fair value of contingent
consideration (7) – – – (7) –(7)
Financing fair value remeasurements (note 14(c)) – – – – – (81) (81)
Profit/(loss) before tax 749 99 130 265 1,243 (237) 1,006
A loss before tax of US$20m arose in the year ended 31 March 2016 in respect of discontinued operations. Further information is
given in note 16(a).
Additional information by business segment, including that on total and organic growth at constant exchange rates, is provided in
the Strategic report section. Revenue and Total EBIT by business segment for the year ended 31 March 2015 are now re-analysed
in the above table between continuing and discontinuing activities, following the disposal of a number of businesses during the
current year.