Experian 2016 Annual Report Download - page 140
Download and view the complete annual report
Please find page 140 of the 2016 Experian annual report below. You can navigate through the pages in the report by either clicking on the pages listed below, or by using the keyword search tool below to find specific information within the annual report.-
 1
1 -
2
-
3
-
4
-
5
-
6
-
7
-
8
-
9
-
10
-
11
-
12
-
13
-
14
-
15
-
16
-
17
-
18
-
19
-
20
-
21
-
22
-
23
-
24
-
25
-
26
-
27
-
28
-
29
-
30
-
31
-
32
-
33
-
34
-
35
-
36
-
37
-
38
-
39
-
40
-
41
-
42
-
43
-
44
-
45
-
46
-
47
-
48
-
49
-
50
-
51
-
52
-
53
-
54
-
55
-
56
-
57
-
58
-
59
-
60
-
61
-
62
-
63
-
64
-
65
-
66
-
67
-
68
-
69
-
70
-
71
-
72
-
73
-
74
-
75
-
76
-
77
-
78
-
79
-
80
-
81
-
82
-
83
-
84
-
85
-
86
-
87
-
88
-
89
-
90
-
91
-
92
-
93
-
94
-
95
-
96
-
97
-
98
-
99
-
100
-
101
-
102
-
103
-
104
-
105
-
106
-
107
-
108
-
109
-
110
-
111
-
112
-
113
-
114
-
115
-
116
-
117
-
118
-
119
-
120
-
121
-
122
-
123
-
124
-
125
-
126
-
127
-
128
-
129
-
 130
130 -
 131
131 -
 132
132 -
 133
133 -
 134
134 -
 135
135 -
 136
136 -
 137
137 -
 138
138 -
 139
139 -
 140
140 -
 141
141 -
 142
142 -
 143
143 -
 144
144 -
 145
145 -
 146
146 -
 147
147 -
 148
148 -
 149
149 -
 150
150 -
151
-
152
-
153
-
154
-
155
-
156
-
157
-
158
-
159
-
160
-
161
-
162
-
163
-
164
-
165
-
166
-
167
-
168
-
169
-
170
-
171
-
172
-
173
-
174
-
175
-
176
-
177
-
178
-
179
-
180
-
181
-
182
-
183
-
184
-
185
-
186
-
187
-
188
 |
 |

138
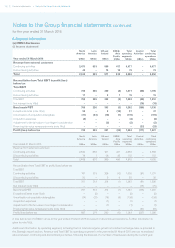
Notes to the Group financial statements continued
for the year ended 31 March 2016
Financial statements •Notes to the Group nancial statements
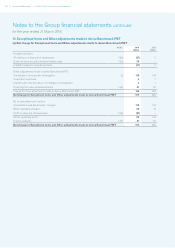
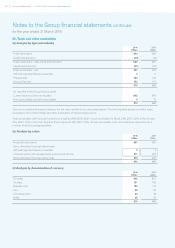
14. Net finance costs
(a) Net finance costs included in profit before tax
2016
US$m
2015
US$m
Interest income:
Bank deposits, short-term investments and loan notes (20) (24)
Interest on opening retirement benefit assets –(1)
Interest income (20) (25)
Finance expense:
Eurobonds and notes 93 100
Bank loans, commercial paper, overdrafts and other 14 13
Commitment and facility fees 5 7
Interest differentials on derivatives (18) (20)
Interest expense 94 100
Charge in respect of financing fair value remeasurements (note 14(c)) 21 81
Finance expense 115 181
Net finance costs included in profit before tax 95 156
(b) Net interest expense included in Benchmark PBT
2016
US$m
2015
US$m
Interest income (20) (25)
Interest expense 94 100
Net interest expense included in Benchmark PBT 74 75
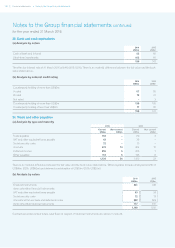
(c) Analysis of charge for financing fair value remeasurements
2016
US$m
2015
US$m
Fair value (gains)/losses on borrowings – attributable to interest rate risk (16) 43
Fair value losses/(gains) on borrowings – attributable to currency risk 22 (261)
Gains on interest rate swaps – fair value hedges (2) (18)
(Gains)/losses on cross currency swaps – fair value hedges (10) 235
Fair value losses on non-hedging derivatives 21
Foreign exchange losses on Brazilian real intra-Group funding 33 86
Other foreign exchange losses/(gains) on financing activities 7(4)
Gain in connection with commitments to purchase own shares (2) –
Decrease in present value of put options (13) (1)
Charge for financing fair value remeasurements 21 81
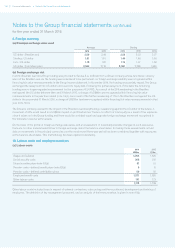
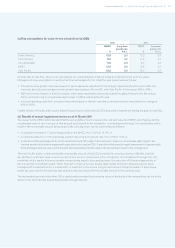
(d) Interest rate risk
The following table shows the sensitivity to interest rate risk on the basis of the profile of Net debt at the balance sheet dates and
an assessment of reasonably possible changes in the principal interest rates, with all other variables held constant. In making this
assessment, actual movements in relevant interest rates over the most recent three-year period have been considered and a consistent
methodology applied. An indication of the primary cause of the reported sensitivity of profit for the financial year is included.
(Loss)/gain
2016
US$m
2015
US$m
Effect of an increase of 0.1% (2015: 0.1%) on US dollar-denominated Net debt:
Due to fair value gains on interest rate swaps offset by higher interest on floating rate borrowings 34
Effect of an increase of 0.1% (2015: 0.1%) on sterling-denominated Net debt:
Due to the revaluation of borrowings and related derivatives (1) (1)
Effect of an increase of 2.3% (2015: 2.7%) on Brazilian real-denominated Net debt:
Due to higher interest income on cash and cash equivalents 21
Effect of an increase of 0.2% (2015: 0.4%) on euro-denominated Net debt:
Due to fair value gains on interest rate swaps offset by higher interest on floating rate borrowings –(1)