Experian 2016 Annual Report Download - page 147
Download and view the complete annual report
Please find page 147 of the 2016 Experian annual report below. You can navigate through the pages in the report by either clicking on the pages listed below, or by using the keyword search tool below to find specific information within the annual report.-
 1
1 -
2
-
3
-
4
-
5
-
6
-
7
-
8
-
9
-
10
-
11
-
12
-
13
-
14
-
15
-
16
-
17
-
18
-
19
-
20
-
21
-
22
-
23
-
24
-
25
-
26
-
27
-
28
-
29
-
30
-
31
-
32
-
33
-
34
-
35
-
36
-
37
-
38
-
39
-
40
-
41
-
42
-
43
-
44
-
45
-
46
-
47
-
48
-
49
-
50
-
51
-
52
-
53
-
54
-
55
-
56
-
57
-
58
-
59
-
60
-
61
-
62
-
63
-
64
-
65
-
66
-
67
-
68
-
69
-
70
-
71
-
72
-
73
-
74
-
75
-
76
-
77
-
78
-
79
-
80
-
81
-
82
-
83
-
84
-
85
-
86
-
87
-
88
-
89
-
90
-
91
-
92
-
93
-
94
-
95
-
96
-
97
-
98
-
99
-
100
-
101
-
102
-
103
-
104
-
105
-
106
-
107
-
108
-
109
-
110
-
111
-
112
-
113
-
114
-
115
-
116
-
117
-
118
-
119
-
120
-
121
-
122
-
123
-
124
-
125
-
126
-
127
-
128
-
129
-
130
-
131
-
132
-
133
-
134
-
135
-
136
-
 137
137 -
 138
138 -
 139
139 -
 140
140 -
 141
141 -
 142
142 -
 143
143 -
 144
144 -
 145
145 -
 146
146 -
 147
147 -
 148
148 -
 149
149 -
 150
150 -
 151
151 -
 152
152 -
 153
153 -
 154
154 -
 155
155 -
 156
156 -
 157
157 -
158
-
159
-
160
-
161
-
162
-
163
-
164
-
165
-
166
-
167
-
168
-
169
-
170
-
171
-
172
-
173
-
174
-
175
-
176
-
177
-
178
-
179
-
180
-
181
-
182
-
183
-
184
-
185
-
186
-
187
-
188
 |
 |

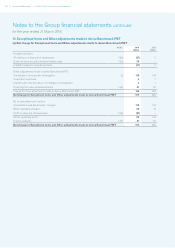
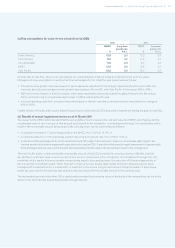
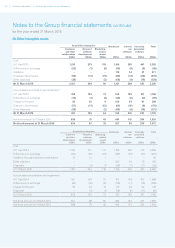
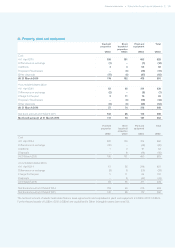
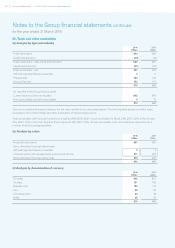
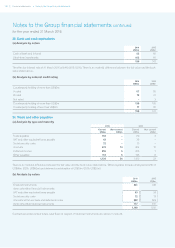
145•Notes to the Group nancial statementsFinancial statements
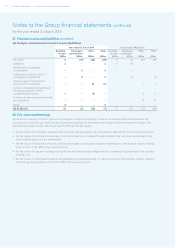
21. Property, plant and equipment
Freehold
properties
US$m
Short
leasehold
properties
US$m
Plant and
equipment
US$m
Total
US$m
Cost
At 1 April 2015 195 151 483 829
Differences on exchange (7) – (7) (14)
Additions 3 3 62 68
Disposal of businesses –(1) (16) (17)
Other disposals (17) (1) (47) (65)
At 31 March 2016 174 152 475 801
Accumulated depreciation
At 1 April 2015 63 65 311 439
Differences on exchange (2) – (5) (7)
Charge for the year 2 11 70 83
Disposal of businesses –(1) (13) (14)
Other disposals (6) (1) (45) (52)
At 31 March 2016 57 74 318 449
Net book amount at 31 March 2015 132 86 172 390
Net book amount at 31 March 2016 117 78 157 352
Freehold
properties
US$m
Short
leasehold
properties
US$m
Plant and
equipment
US$m
Total
US$m
Cost
At 1 April 2014 226 150 514 890
Differences on exchange (32) –(48) (80)
Additions 1 2 61 64
Disposals –(1) (44) (45)
At 31 March 2015 195 151 483 829
Accumulated depreciation
At 1 April 2014 67 56 298 421
Differences on exchange (9) (1) (29) (39)
Charge for the year 511 84 100
Disposals –(1) (42) (43)
At 31 March 2015 63 65 311 439
Net book amount at 31 March 2014 159 94 216 469
Net book amount at 31 March 2015 132 86 172 390
The net book amount of assets held under finance lease agreements and capitalised in plant and equipment is US$1m (2015: US$3m).
Further leased assets of US$2m (2015: US$5m) are capitalised in Other intangible assets (see note 20).