Experian 2016 Annual Report Download - page 117
Download and view the complete annual report
Please find page 117 of the 2016 Experian annual report below. You can navigate through the pages in the report by either clicking on the pages listed below, or by using the keyword search tool below to find specific information within the annual report.-
 1
1 -
2
-
3
-
4
-
5
-
6
-
7
-
8
-
9
-
10
-
11
-
12
-
13
-
14
-
15
-
16
-
17
-
18
-
19
-
20
-
21
-
22
-
23
-
24
-
25
-
26
-
27
-
28
-
29
-
30
-
31
-
32
-
33
-
34
-
35
-
36
-
37
-
38
-
39
-
40
-
41
-
42
-
43
-
44
-
45
-
46
-
47
-
48
-
49
-
50
-
51
-
52
-
53
-
54
-
55
-
56
-
57
-
58
-
59
-
60
-
61
-
62
-
63
-
64
-
65
-
66
-
67
-
68
-
69
-
70
-
71
-
72
-
73
-
74
-
75
-
76
-
77
-
78
-
79
-
80
-
81
-
82
-
83
-
84
-
85
-
86
-
87
-
88
-
89
-
90
-
91
-
92
-
93
-
94
-
95
-
96
-
97
-
98
-
99
-
100
-
101
-
102
-
103
-
104
-
105
-
106
-
 107
107 -
 108
108 -
 109
109 -
 110
110 -
 111
111 -
 112
112 -
 113
113 -
 114
114 -
 115
115 -
 116
116 -
 117
117 -
 118
118 -
 119
119 -
 120
120 -
 121
121 -
 122
122 -
 123
123 -
 124
124 -
 125
125 -
 126
126 -
 127
127 -
128
-
129
-
130
-
131
-
132
-
133
-
134
-
135
-
136
-
137
-
138
-
139
-
140
-
141
-
142
-
143
-
144
-
145
-
146
-
147
-
148
-
149
-
150
-
151
-
152
-
153
-
154
-
155
-
156
-
157
-
158
-
159
-
160
-
161
-
162
-
163
-
164
-
165
-
166
-
167
-
168
-
169
-
170
-
171
-
172
-
173
-
174
-
175
-
176
-
177
-
178
-
179
-
180
-
181
-
182
-
183
-
184
-
185
-
186
-
187
-
188
 |
 |

115•Financial statements Group balance sheet
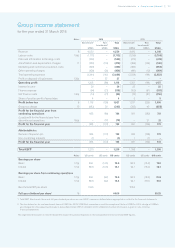
Group balance sheet
at 31 March 2016
Notes 2016
US$m
2015
US$m
Non-current assets
Goodwill 19 4,198 4,393
Other intangible assets 20 1,431 1,624
Property, plant and equipment 21 352 390
Investments in associates 8 8
Deferred tax assets 33(a) 159 264
Post-employment benefit assets 32(a) 26 58
Trade and other receivables 22(a) 8 10
Available-for-sale financial assets 27(a) 43 40
Other financial assets 27(b) 53 125
6,278 6,912
Current assets
Inventories 1 3
Trade and other receivables 22(a) 902 878
Current tax assets 33(b) 24 29
Other financial assets 27(b) 46 8
Cash and cash equivalents 23(a) 156 147
1,129 1,065
Current liabilities
Trade and other payables 24(a) (1,124) (1,122)
Borrowings 25(a) (52) (146)
Current tax liabilities 33(b) (128) (91)
Provisions 34 (27) (31)
Other financial liabilities 27(b) (12) (14)
(1,343) (1,404)
Net current liabilities (214) (339)
Total assets less current liabilities 6,064 6,573
Non-current liabilities
Trade and other payables 24(a) (24) (33)
Borrowings 25(a) (3,068) (3,146)
Deferred tax liabilities 33(a) (352) (385)
Post-employment benefit obligations 32(a) (55) (60)
Other financial liabilities 27(b) (127) (148)
(3,626) (3,772)
Net assets 2,438 2,801
Equity
Called up share capital 35 102 103
Share premium account 35 1,519 1,506
Retained earnings 36 18,633 18,523
Other reserves 36 (17,830) (17,346)
Attributable to owners of Experian plc 2,424 2,786
Non-controlling interests 14 15
Total equity 2,438 2,801
These financial statements were approved by the Board on 10 May 2016 and were signed on its behalf by:
George Rose
Director