Experian 2016 Annual Report Download - page 115
Download and view the complete annual report
Please find page 115 of the 2016 Experian annual report below. You can navigate through the pages in the report by either clicking on the pages listed below, or by using the keyword search tool below to find specific information within the annual report.-
 1
1 -
2
-
3
-
4
-
5
-
6
-
7
-
8
-
9
-
10
-
11
-
12
-
13
-
14
-
15
-
16
-
17
-
18
-
19
-
20
-
21
-
22
-
23
-
24
-
25
-
26
-
27
-
28
-
29
-
30
-
31
-
32
-
33
-
34
-
35
-
36
-
37
-
38
-
39
-
40
-
41
-
42
-
43
-
44
-
45
-
46
-
47
-
48
-
49
-
50
-
51
-
52
-
53
-
54
-
55
-
56
-
57
-
58
-
59
-
60
-
61
-
62
-
63
-
64
-
65
-
66
-
67
-
68
-
69
-
70
-
71
-
72
-
73
-
74
-
75
-
76
-
77
-
78
-
79
-
80
-
81
-
82
-
83
-
84
-
85
-
86
-
87
-
88
-
89
-
90
-
91
-
92
-
93
-
94
-
95
-
96
-
97
-
98
-
99
-
100
-
101
-
102
-
103
-
104
-
 105
105 -
 106
106 -
 107
107 -
 108
108 -
 109
109 -
 110
110 -
 111
111 -
 112
112 -
 113
113 -
 114
114 -
 115
115 -
 116
116 -
 117
117 -
 118
118 -
 119
119 -
 120
120 -
 121
121 -
 122
122 -
 123
123 -
 124
124 -
 125
125 -
126
-
127
-
128
-
129
-
130
-
131
-
132
-
133
-
134
-
135
-
136
-
137
-
138
-
139
-
140
-
141
-
142
-
143
-
144
-
145
-
146
-
147
-
148
-
149
-
150
-
151
-
152
-
153
-
154
-
155
-
156
-
157
-
158
-
159
-
160
-
161
-
162
-
163
-
164
-
165
-
166
-
167
-
168
-
169
-
170
-
171
-
172
-
173
-
174
-
175
-
176
-
177
-
178
-
179
-
180
-
181
-
182
-
183
-
184
-
185
-
186
-
187
-
188
 |
 |

113
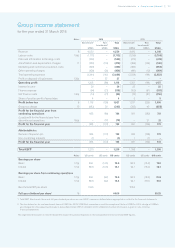
Group income statement
for the year ended 31 March 2016
Notes 2016 2015
Benchmark1
US$m
Non-
benchmark2
US$m
Total
US$m
Benchmark1
US$m
Non-
benchmark2
US$m
Total
US$m
Revenue 84,550 –4,550 4,810 –4,810
Labour costs 10(a) (1,712) –(1,712) (1,799) –(1,799)
Data and information technology costs (502) –(502) (470) –(470)
Amortisation and depreciation charges 11 (353) (119) (472) (384) (134) (518)
Marketing and customer acquisition costs (349) –(349) (365) –(365)
Other operating charges (428) (26) (454) (491) (10) (501)
Total operating expenses (3,344) (145) (3,489) (3,509) (144) (3,653)
Profit on disposal of businesses 13(b) –57 57 – – –
Operating profit 1,206 (88) 1,118 1,301 (144) 1,157
Interest income 20 –20 25 – 25
Finance expense (94) (21) (115) (100) (81) (181)
Net finance costs 14(a) (74) (21) (95) (75) (81) (156)
Share of post-tax profit of associates 4 – 45 – 5
Profit before tax 81,136 (109) 1,027 1,231 (225) 1,006
Group tax charge 15 (283) 20 (263) (300) 45 (255)
Profit for the financial year from
continuing operations 853 (89) 764 931 (180) 751
(Loss)/profit for the financial year from
discontinued operations 16(a) –(12) (12) – 21 21
Profit for the financial year 853 (101) 752 931 (159) 772
Attributable to:
Owners of Experian plc 854 (101) 753 930 (158) 772
Non-controlling interests (1) –(1) 1 (1) –
Profit for the financial year 853 (101) 752 931 (159) 772
Total EBIT11,210 –1,210 1,306 –1,306
Notes US cents US cents US cents US cents US cents US cents
Earnings per share
Basic 17(a) 89.1 (10.5) 78.6 95.2 (16.2) 79.0
Diluted 17(a) 88.6 (10.5) 78.1 94.1 (16.0) 78.1
Earnings per share from continuing operations
Basic 17(a) 89.1 (9.2) 79.9 95.2 (18.3) 76.9
Diluted 17(a) 88.6 (9.2) 79.4 94.1 (18.1) 76.0
Benchmark PBT per share1118.6 126.0
Full year dividend per share118 40.00 39.25
1. Total EBIT, Benchmark items and full year dividend per share are non-GAAP measures, defined where appropriate in note 6 to the financial statements.
2. The loss before tax for non-benchmark items of US$109m (2015: US$225m) comprises a credit for exceptional items of US$37m (2015: charge of US$2m)
and charges for other adjustments made to derive Benchmark PBT of US$146m (2015: US$223m). Further information is given in note 13 to the
financial statements.
The segmental disclosures in note 8 indicate the impact of business disposals on the comparative revenue and Total EBIT figures.
•Financial statements Group income statement