Experian 2016 Annual Report Download - page 133
Download and view the complete annual report
Please find page 133 of the 2016 Experian annual report below. You can navigate through the pages in the report by either clicking on the pages listed below, or by using the keyword search tool below to find specific information within the annual report.-
 1
1 -
2
-
3
-
4
-
5
-
6
-
7
-
8
-
9
-
10
-
11
-
12
-
13
-
14
-
15
-
16
-
17
-
18
-
19
-
20
-
21
-
22
-
23
-
24
-
25
-
26
-
27
-
28
-
29
-
30
-
31
-
32
-
33
-
34
-
35
-
36
-
37
-
38
-
39
-
40
-
41
-
42
-
43
-
44
-
45
-
46
-
47
-
48
-
49
-
50
-
51
-
52
-
53
-
54
-
55
-
56
-
57
-
58
-
59
-
60
-
61
-
62
-
63
-
64
-
65
-
66
-
67
-
68
-
69
-
70
-
71
-
72
-
73
-
74
-
75
-
76
-
77
-
78
-
79
-
80
-
81
-
82
-
83
-
84
-
85
-
86
-
87
-
88
-
89
-
90
-
91
-
92
-
93
-
94
-
95
-
96
-
97
-
98
-
99
-
100
-
101
-
102
-
103
-
104
-
105
-
106
-
107
-
108
-
109
-
110
-
111
-
112
-
113
-
114
-
115
-
116
-
117
-
118
-
119
-
120
-
121
-
122
-
 123
123 -
 124
124 -
 125
125 -
 126
126 -
 127
127 -
 128
128 -
 129
129 -
 130
130 -
 131
131 -
 132
132 -
 133
133 -
 134
134 -
 135
135 -
 136
136 -
 137
137 -
 138
138 -
 139
139 -
 140
140 -
 141
141 -
 142
142 -
 143
143 -
144
-
145
-
146
-
147
-
148
-
149
-
150
-
151
-
152
-
153
-
154
-
155
-
156
-
157
-
158
-
159
-
160
-
161
-
162
-
163
-
164
-
165
-
166
-
167
-
168
-
169
-
170
-
171
-
172
-
173
-
174
-
175
-
176
-
177
-
178
-
179
-
180
-
181
-
182
-
183
-
184
-
185
-
186
-
187
-
188
 |
 |

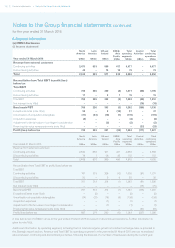
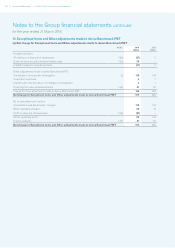
131•Notes to the Group nancial statementsFinancial statements
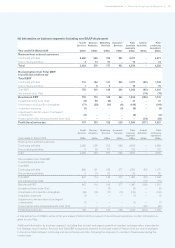
(ii) Balance sheet
Net assets/(liabilities)
At 31 March 2016
North
America
US$m
Latin
America
US$m
UK and
Ireland
US$m
EMEA/
Asia Pacific
US$m
Total
operating
segments
US$m
Central
Activities
and other
US$m
Total
Group
US$m
Goodwill 2,474 731 680 313 4,198 – 4,198
Investments in associates 3 – – 5 8 – 8
Other assets 1,439 481 415 253 2,588 613 3,201
Total assets 3,916 1,212 1,095 571 6,794 613 7,407
Total liabilities (553) (135) (309) (150) (1,147) (3,822) (4,969)
Net assets/(liabilities) 3,363 1,077 786 421 5,647 (3,209) 2,438
At 31 March 2015
North
America
US$m
Latin
America
US$m
UK and
Ireland
US$m
EMEA/
Asia Pacific
US$m
Total
operating
segments
US$m
Central
Activities
and other
US$m
Total
Group
US$m
Goodwill 2,518 816 697 362 4,393 –4,393
Investments in associates 2 – – 6 8 – 8
Other assets 1,560 508 476 282 2,826 750 3,576
Total assets 4,080 1,324 1,173 650 7,227 750 7,977
Total liabilities (541) (125) (331) (191) (1,188) (3,988) (5,176)
Net assets/(liabilities) 3,539 1,199 842 459 6,039 (3,238) 2,801
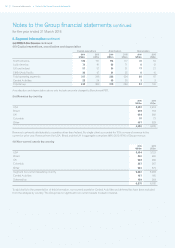
Central Activities and other comprises:
2016 2015
Assets
US$m
Liabilities
US$m
Net assets/
(liabilities)
US$m
Assets
US$m
Liabilities
US$m
Net assets/
(liabilities)
US$m
Central Activities 258 (147) 111 294 (132) 162
Net debt 172 (3,195) (3,023) 163 (3,380) (3,217)
Tax 183 (480) (297) 293 (476) (183)
613 (3,822) (3,209) 750 (3,988) (3,238)
Capital employed
2016
US$m
2015
US$m
North America 3,363 3,539
Latin America 1,077 1,199
UK and Ireland 786 842
EMEA/Asia Pacific 421 459
Total operating segments 5,647 6,039
Central Activities 111 162
Non-controlling interests (14) (15)
Capital employed attributable to owners 5,744 6,186