Experian 2016 Annual Report Download - page 145
Download and view the complete annual report
Please find page 145 of the 2016 Experian annual report below. You can navigate through the pages in the report by either clicking on the pages listed below, or by using the keyword search tool below to find specific information within the annual report.-
 1
1 -
2
-
3
-
4
-
5
-
6
-
7
-
8
-
9
-
10
-
11
-
12
-
13
-
14
-
15
-
16
-
17
-
18
-
19
-
20
-
21
-
22
-
23
-
24
-
25
-
26
-
27
-
28
-
29
-
30
-
31
-
32
-
33
-
34
-
35
-
36
-
37
-
38
-
39
-
40
-
41
-
42
-
43
-
44
-
45
-
46
-
47
-
48
-
49
-
50
-
51
-
52
-
53
-
54
-
55
-
56
-
57
-
58
-
59
-
60
-
61
-
62
-
63
-
64
-
65
-
66
-
67
-
68
-
69
-
70
-
71
-
72
-
73
-
74
-
75
-
76
-
77
-
78
-
79
-
80
-
81
-
82
-
83
-
84
-
85
-
86
-
87
-
88
-
89
-
90
-
91
-
92
-
93
-
94
-
95
-
96
-
97
-
98
-
99
-
100
-
101
-
102
-
103
-
104
-
105
-
106
-
107
-
108
-
109
-
110
-
111
-
112
-
113
-
114
-
115
-
116
-
117
-
118
-
119
-
120
-
121
-
122
-
123
-
124
-
125
-
126
-
127
-
128
-
129
-
130
-
131
-
132
-
133
-
134
-
 135
135 -
 136
136 -
 137
137 -
 138
138 -
 139
139 -
 140
140 -
 141
141 -
 142
142 -
 143
143 -
 144
144 -
 145
145 -
 146
146 -
 147
147 -
 148
148 -
 149
149 -
 150
150 -
 151
151 -
 152
152 -
 153
153 -
 154
154 -
 155
155 -
156
-
157
-
158
-
159
-
160
-
161
-
162
-
163
-
164
-
165
-
166
-
167
-
168
-
169
-
170
-
171
-
172
-
173
-
174
-
175
-
176
-
177
-
178
-
179
-
180
-
181
-
182
-
183
-
184
-
185
-
186
-
187
-
188
 |
 |

143•Notes to the Group nancial statementsFinancial statements
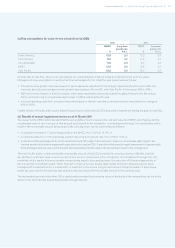
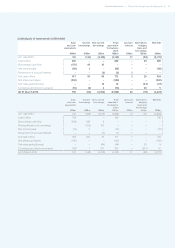
(c) Key assumptions for value-in-use calculations by CGU
2016 2015
WACC
%
Long-term
growth rate
% p.a.
WACC
%
Long-term
growth rate
% p.a.
North America 12.9 2.3 12.2 2.3
Latin America 17.0 4.7 17.6 4.7
UK and Ireland 9.5 2.3 9.3 2.3
EMEA 13.0 3.5 12.3 3.1
Asia Pacific 12.2 5.3 13.0 5.3
As indicated in note 5(a), value-in-use calculations are underpinned by financial budgets, looking forward up to five years.
Management’s key assumptions in setting the financial budgets for the initial five-year period were as follows:
• forecast revenue growth rates were based on past experience, adjusted for the strategic opportunities within each CGU; the
forecasts typically used average nominal growth rates between 3% and 9%, with Asia Pacific in the range of 8% to 20%;
• EBIT was forecast based on historic margins, which were expected to be broadly stable throughout the period in the mature
CGUs, and improving to a low double-digit margin in EMEA and Asia Pacific; and
• forecast operating cash flow conversion rates were based on historic experience and performance expectations in a range of
90% to 100%.
Further details of the principles used in determining the basis of allocation by CGU and annual impairment testing are given in note 5(a).
(d) Results of annual impairment review as at 31 March 2016
The review for the EMEA CGU indicated that the recoverable amount exceeded the carrying value by US$50m and that any decline
in estimated value-in-use in excess of that amount would result in the recognition of an impairment charge. The sensitivities, which
result in the recoverable amount being equal to the carrying value, can be summarised as follows:
• an absolute increase of 1.7 percentage points in the WACC, from 13.0% to 14.7%; or
• an absolute reduction of 2.5 percentage points in the long-term growth rate, from 3.5% to 1.0%; or
• a reduction of 2.6 percentage points in the forecast terminal profit margin. This is forecast to improve to a low double-digit margin in the
terminal period but is below management’s expectations for a mature CGU. A reduction in the annual margin improvement of approximately
0.5 percentage points per year over the five-year forecast period would also reduce the recoverable amount to the carrying value.
The Asia Pacific review confirmed that the recoverable amount of that CGU exceeded its carrying value by US$146m and that
any decline in estimated value-in-use in excess of that amount would result in the recognition of an impairment charge. The only
sensitivity, which results in the recoverable amount being equal to the carrying value, is a reduction of 5.9 percentage points in
the forecast terminal profit margin. This is forecast to improve to a low double-digit margin in the terminal period but is below
management’s expectations for a mature CGU. A reduction in the annual margin improvement of approximately 1.2 percentage
points per year over the five-year forecast period would also reduce the recoverable amount to the carrying value.
The recoverable amount of the other CGUs significantly exceeded their carrying value on the basis of the assumptions set out in the
table in note 19(c) and any reasonably possible changes thereof.