Experian 2016 Annual Report Download - page 154
Download and view the complete annual report
Please find page 154 of the 2016 Experian annual report below. You can navigate through the pages in the report by either clicking on the pages listed below, or by using the keyword search tool below to find specific information within the annual report.-
 1
1 -
2
-
3
-
4
-
5
-
6
-
7
-
8
-
9
-
10
-
11
-
12
-
13
-
14
-
15
-
16
-
17
-
18
-
19
-
20
-
21
-
22
-
23
-
24
-
25
-
26
-
27
-
28
-
29
-
30
-
31
-
32
-
33
-
34
-
35
-
36
-
37
-
38
-
39
-
40
-
41
-
42
-
43
-
44
-
45
-
46
-
47
-
48
-
49
-
50
-
51
-
52
-
53
-
54
-
55
-
56
-
57
-
58
-
59
-
60
-
61
-
62
-
63
-
64
-
65
-
66
-
67
-
68
-
69
-
70
-
71
-
72
-
73
-
74
-
75
-
76
-
77
-
78
-
79
-
80
-
81
-
82
-
83
-
84
-
85
-
86
-
87
-
88
-
89
-
90
-
91
-
92
-
93
-
94
-
95
-
96
-
97
-
98
-
99
-
100
-
101
-
102
-
103
-
104
-
105
-
106
-
107
-
108
-
109
-
110
-
111
-
112
-
113
-
114
-
115
-
116
-
117
-
118
-
119
-
120
-
121
-
122
-
123
-
124
-
125
-
126
-
127
-
128
-
129
-
130
-
131
-
132
-
133
-
134
-
135
-
136
-
137
-
138
-
139
-
140
-
141
-
142
-
143
-
 144
144 -
 145
145 -
 146
146 -
 147
147 -
 148
148 -
 149
149 -
 150
150 -
 151
151 -
 152
152 -
 153
153 -
 154
154 -
 155
155 -
 156
156 -
 157
157 -
 158
158 -
 159
159 -
 160
160 -
 161
161 -
 162
162 -
 163
163 -
 164
164 -
165
-
166
-
167
-
168
-
169
-
170
-
171
-
172
-
173
-
174
-
175
-
176
-
177
-
178
-
179
-
180
-
181
-
182
-
183
-
184
-
185
-
186
-
187
-
188
 |
 |

152
Notes to the Group financial statements continued
for the year ended 31 March 2016
Financial statements •Notes to the Group nancial statements
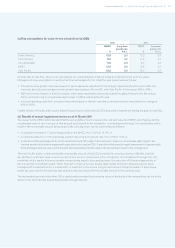
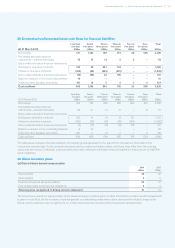
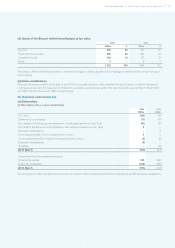
27. Financial assets and liabilities
(a) Available-for-sale financial assets
Assets of US$43m (2015: US$40m) include listed investments of US$33m (2015: US$35m) held in the UK to secure certain unfunded
pension arrangements (note 31(b)).
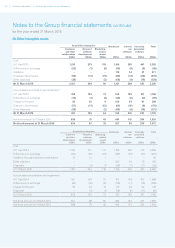
(b) Other financial assets and liabilities
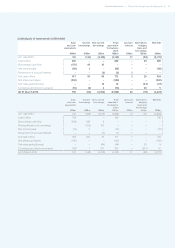
(i) Summary
Assets
2016 2015
Current
US$m
Non-current
US$m
Total
US$m
Current
US$m
Non-current
US$m
Total
US$m
Loans and receivables 41 –41 – 74 74
Derivative financial instruments:
Fair value hedge of borrowings (cross currency swaps) – – – – 5 5
Fair value hedge of borrowings (interest rate swaps) – 21 21 – 18 18
Derivatives used for hedging – 21 21 – 23 23
Non-hedging derivatives (equity swaps) 1 – 1 1 – 1
Non-hedging derivatives (foreign exchange contracts) 4 – 4 7 – 7
Non-hedging derivatives (interest rate swaps) – 32 32 – 28 28
Assets at fair value through profit and loss 5 32 37 8 28 36
Derivative financial instruments – total 5 53 58 8 51 59
Other derivatives – – – – – –
Total other financial assets 46 53 99 8 125 133
Liabilities
2016 2015
Current
US$m
Non-current
US$m
Total
US$m
Current
US$m
Non-current
US$m
Total
US$m
Derivative financial instruments:
Fair value hedge of borrowings (cross currency swaps) – 80 80 – 94 94
Fair value hedge of borrowings (interest rate swaps) – – – – – –
Derivatives used for hedging – 80 80 – 94 94
Non-hedging derivatives (equity swaps) – – – – – –
Non-hedging derivatives (foreign exchange contracts) 10 – 10 11 – 11
Non-hedging derivatives (interest rate swaps) 2 37 39 3 32 35
Liabilities at fair value through profit and loss 12 37 49 14 32 46
Derivative financial instruments – total 12 117 129 14 126 140
Options in respect of non-controlling interests – 10 10 – 22 22
Total other financial liabilities 12 127 139 14 148 162
Amounts recognised in the Group income statement in connection with the Group’s hedging instruments are disclosed in note 14.
There is no material difference between the fair values and the book values stated above.
Loans and receivables principally comprise amounts due following the disposal of businesses and the amount of US$41m at
31 March 2016 is stated after an impairment charge of US$20m in the year then ended. This charge is reported within the loss
for the financial year from discontinued operations (see note 16(a)).