Experian 2016 Annual Report Download - page 31
Download and view the complete annual report
Please find page 31 of the 2016 Experian annual report below. You can navigate through the pages in the report by either clicking on the pages listed below, or by using the keyword search tool below to find specific information within the annual report.-
 1
1 -
2
-
3
-
4
-
5
-
6
-
7
-
8
-
9
-
10
-
11
-
12
-
13
-
14
-
15
-
16
-
17
-
18
-
19
-
20
-
 21
21 -
 22
22 -
 23
23 -
 24
24 -
 25
25 -
 26
26 -
 27
27 -
 28
28 -
 29
29 -
 30
30 -
 31
31 -
 32
32 -
 33
33 -
 34
34 -
 35
35 -
 36
36 -
 37
37 -
 38
38 -
 39
39 -
 40
40 -
 41
41 -
42
-
43
-
44
-
45
-
46
-
47
-
48
-
49
-
50
-
51
-
52
-
53
-
54
-
55
-
56
-
57
-
58
-
59
-
60
-
61
-
62
-
63
-
64
-
65
-
66
-
67
-
68
-
69
-
70
-
71
-
72
-
73
-
74
-
75
-
76
-
77
-
78
-
79
-
80
-
81
-
82
-
83
-
84
-
85
-
86
-
87
-
88
-
89
-
90
-
91
-
92
-
93
-
94
-
95
-
96
-
97
-
98
-
99
-
100
-
101
-
102
-
103
-
104
-
105
-
106
-
107
-
108
-
109
-
110
-
111
-
112
-
113
-
114
-
115
-
116
-
117
-
118
-
119
-
120
-
121
-
122
-
123
-
124
-
125
-
126
-
127
-
128
-
129
-
130
-
131
-
132
-
133
-
134
-
135
-
136
-
137
-
138
-
139
-
140
-
141
-
142
-
143
-
144
-
145
-
146
-
147
-
148
-
149
-
150
-
151
-
152
-
153
-
154
-
155
-
156
-
157
-
158
-
159
-
160
-
161
-
162
-
163
-
164
-
165
-
166
-
167
-
168
-
169
-
170
-
171
-
172
-
173
-
174
-
175
-
176
-
177
-
178
-
179
-
180
-
181
-
182
-
183
-
184
-
185
-
186
-
187
-
188
 |
 |

29
EMEA/Asia Pacific
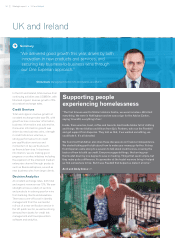
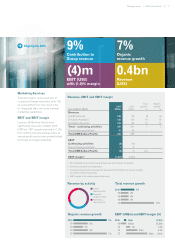
We have delivered good revenue growth
in EMEA/Asia Pacific, with organic
revenue growth of 7%.
The actions we’ve taken to improve
performance in EMEA/Asia Pacific are
paying off with better revenue growth
and improving margins. We have
reorganised to drive scale and adopted
a more customer-centric approach.
We’re now focused on fewer markets.
We have reduced complexity, centralised
functions, and got our largest countries
focused on our most successful
products. Our growth is being driven
by combining credit data with credit
decisioning software and analytics,
and by focusing on fraud prevention
and identity verification, and we’re
winning new deals in cross-channel
marketing. As a result, the average
contract value on new wins is increasing,
particularly in Asia Pacific, and we
have a strong pipeline. We will continue
with this focused approach and look to
further enhance profitability over the
coming year.
EBIT margin
We maintained EBIT margin at constant
currency. We faced exceptional foreign
exchange movements which reduced
reported Group revenue by US$412m
and EBIT by US$137m compared to last
year and which gave rise to a 60 basis
points reduction in the actual EBIT
margin to 26.7%. If recent rates prevail,
we no longer expect foreign exchange
to be a headwind for the year ending
31 March 2017.
Cash generation and
uses of cash
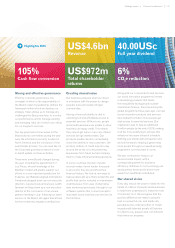
Cash flow conversion was strong, with
EBIT conversion into operating cash
flow of 105%. Operating cash flow was
US$1,270m, of which US$325m was
utilised in organic capital investment.
Net disposal proceeds amounted
to US$163m, net share purchases
were US$592m and equity dividends
amounted to US$380m. After other
small outflows, Net debt was reduced
by US$194m to US$3,023m.
At 31 March 2016, Net debt was
1.9 times EBITDA, compared to our
target leverage range of 2.0 to 2.5 times.
After the year-end, we announced a
definitive agreement to acquire CSID for
US$360m. Pro forma for this acquisition,
Net debt to EBITDA would be 2.1 times
for the year ended 31 March 2016.
Return on capital employed
Return on capital employed for the
year was 15.4% (2015: 14.9%). This
represented organic improvement of
70 basis points, offset by a 20 basis
points headwind from disposals and
foreign exchange effects.
Dividend and share purchases
We are announcing a second interim
dividend of 27.5 US cents per share,
to bring the total for the year ended
31 March 2016 to 40.0 US cents per
share, up 2% on the prior year. This
dividend will be paid on 22 July 2016 to
shareholders on the register at the close
of business on 24 June 2016. We also
expect to execute share purchases of
US$400m in the forthcoming year, which
includes US$144m to complete the
existing US$800m programme.
Strategic report •Chief Executive’s review