Experian 2016 Annual Report Download - page 164
Download and view the complete annual report
Please find page 164 of the 2016 Experian annual report below. You can navigate through the pages in the report by either clicking on the pages listed below, or by using the keyword search tool below to find specific information within the annual report.-
 1
1 -
2
-
3
-
4
-
5
-
6
-
7
-
8
-
9
-
10
-
11
-
12
-
13
-
14
-
15
-
16
-
17
-
18
-
19
-
20
-
21
-
22
-
23
-
24
-
25
-
26
-
27
-
28
-
29
-
30
-
31
-
32
-
33
-
34
-
35
-
36
-
37
-
38
-
39
-
40
-
41
-
42
-
43
-
44
-
45
-
46
-
47
-
48
-
49
-
50
-
51
-
52
-
53
-
54
-
55
-
56
-
57
-
58
-
59
-
60
-
61
-
62
-
63
-
64
-
65
-
66
-
67
-
68
-
69
-
70
-
71
-
72
-
73
-
74
-
75
-
76
-
77
-
78
-
79
-
80
-
81
-
82
-
83
-
84
-
85
-
86
-
87
-
88
-
89
-
90
-
91
-
92
-
93
-
94
-
95
-
96
-
97
-
98
-
99
-
100
-
101
-
102
-
103
-
104
-
105
-
106
-
107
-
108
-
109
-
110
-
111
-
112
-
113
-
114
-
115
-
116
-
117
-
118
-
119
-
120
-
121
-
122
-
123
-
124
-
125
-
126
-
127
-
128
-
129
-
130
-
131
-
132
-
133
-
134
-
135
-
136
-
137
-
138
-
139
-
140
-
141
-
142
-
143
-
144
-
145
-
146
-
147
-
148
-
149
-
150
-
151
-
152
-
153
-
 154
154 -
 155
155 -
 156
156 -
 157
157 -
 158
158 -
 159
159 -
 160
160 -
 161
161 -
 162
162 -
 163
163 -
 164
164 -
 165
165 -
 166
166 -
 167
167 -
 168
168 -
 169
169 -
 170
170 -
 171
171 -
 172
172 -
 173
173 -
 174
174 -
175
-
176
-
177
-
178
-
179
-
180
-
181
-
182
-
183
-
184
-
185
-
186
-
187
-
188
 |
 |

162
Notes to the Group financial statements continued
for the year ended 31 March 2016
Financial statements •Notes to the Group nancial statements
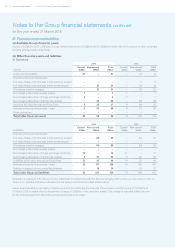
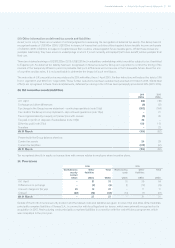
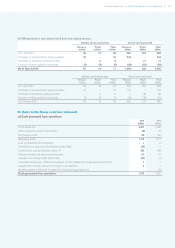
33. Deferred and current tax continued
(a) Deferred tax continued
(ii) Movements in gross deferred tax assets and liabilities
Assets
Intangibles
US$m
Tax lo sses
US$m
Share
incentive
plans
US$m
Accelerated
depreciation
US$m
Other
US$m
Total
US$m
At 1 April 2015 390 139 34 20 190 773
Differences on exchange (39) (1) – – (4) (44)
Tax recognised in the Group income statement
– Continuing operations (18) (47) (6) (6) 18 (59)
– Discontinued operations – – – – 8 8
Tax recognised within other
comprehensive income – – – – 6 6
Tax recognised directly in equity
on transactions with owners – – (3) – – (3)
Disposal of subsidiaries (3) – – – (2) (5)
Transfers (1) – – – 13 12
At 31 March 2016 329 91 25 14 229 688
Assets
Intangibles
US$m
Tax losses
US$m
Share
incentive
plans
US$m
Accelerated
depreciation
US$m
Other
US$m
Total
US$m
At 1 April 2014 559 227 37 27 155 1,005
Differences on exchange (157) (3) – (4) (12) (176)
Tax recognised in the Group income statement
– continuing operations (16) (63) (12) (3) 53 (41)
Business combinations – – 14 – – 14
Tax recognised within other
comprehensive income – – – – 3 3
Tax recognised directly in equity
on transactions with owners – – (5) – – (5)
Transfers 4 (22) – – (9) (27)
At 31 March 2015 390 139 34 20 190 773
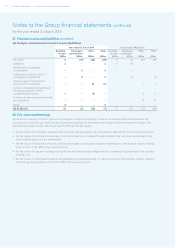
Liabilities
Intangibles
US$m
Accelerated
depreciation
US$m
Other
US$m
Total
US$m
At 1 April 2015 842 28 24 894
Differences on exchange (29) – 2 (27)
Tax recognised in the Group income statement – continuing operations 16 (7) (7) 2
Transfers (1) –13 12
At 31 March 2016 828 21 32 881
Liabilities
Intangibles
US$m
Accelerated
depreciation
US$m
Other
US$m
Total
US$m
At 1 April 2014 894 38 25 957
Differences on exchange (112) – (3) (115)
Tax recognised in the Group income statement – continuing operations 60 (10) – 50
Business combinations 5 – – 5
Transfers (5) – 2 (3)
At 31 March 2015 842 28 24 894
These movements do not take into consideration the offsetting of assets and liabilities within the same tax jurisdiction. Items
classified as Other assets in the above analyses predominantly relate to future tax benefits deferred in line with local tax laws.