Experian 2016 Annual Report Download - page 128
Download and view the complete annual report
Please find page 128 of the 2016 Experian annual report below. You can navigate through the pages in the report by either clicking on the pages listed below, or by using the keyword search tool below to find specific information within the annual report.-
 1
1 -
2
-
3
-
4
-
5
-
6
-
7
-
8
-
9
-
10
-
11
-
12
-
13
-
14
-
15
-
16
-
17
-
18
-
19
-
20
-
21
-
22
-
23
-
24
-
25
-
26
-
27
-
28
-
29
-
30
-
31
-
32
-
33
-
34
-
35
-
36
-
37
-
38
-
39
-
40
-
41
-
42
-
43
-
44
-
45
-
46
-
47
-
48
-
49
-
50
-
51
-
52
-
53
-
54
-
55
-
56
-
57
-
58
-
59
-
60
-
61
-
62
-
63
-
64
-
65
-
66
-
67
-
68
-
69
-
70
-
71
-
72
-
73
-
74
-
75
-
76
-
77
-
78
-
79
-
80
-
81
-
82
-
83
-
84
-
85
-
86
-
87
-
88
-
89
-
90
-
91
-
92
-
93
-
94
-
95
-
96
-
97
-
98
-
99
-
100
-
101
-
102
-
103
-
104
-
105
-
106
-
107
-
108
-
109
-
110
-
111
-
112
-
113
-
114
-
115
-
116
-
117
-
 118
118 -
 119
119 -
 120
120 -
 121
121 -
 122
122 -
 123
123 -
 124
124 -
 125
125 -
 126
126 -
 127
127 -
 128
128 -
 129
129 -
 130
130 -
 131
131 -
 132
132 -
 133
133 -
 134
134 -
 135
135 -
 136
136 -
 137
137 -
 138
138 -
139
-
140
-
141
-
142
-
143
-
144
-
145
-
146
-
147
-
148
-
149
-
150
-
151
-
152
-
153
-
154
-
155
-
156
-
157
-
158
-
159
-
160
-
161
-
162
-
163
-
164
-
165
-
166
-
167
-
168
-
169
-
170
-
171
-
172
-
173
-
174
-
175
-
176
-
177
-
178
-
179
-
180
-
181
-
182
-
183
-
184
-
185
-
186
-
187
-
188
 |
 |

126
Notes to the Group financial statements continued
for the year ended 31 March 2016
Financial statements •Notes to the Group nancial statements
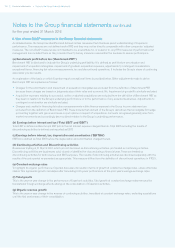
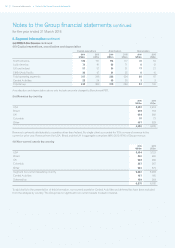
6. Use of non-GAAP measures in the Group financial statements
As detailed below, the Group has identified and defined certain measures that it believes assist understanding of Experian’s
performance. The measures are not defined under IFRS and they may not be directly comparable with other companies’ adjusted
measures. The non-GAAP measures are not intended to be a substitute for, or superior to, any IFRS measures of performance but
management has included them as they consider them to be key measures used within the business to assess performance.
(a) Benchmark profit before tax (‘Benchmark PBT’)
Benchmark PBT is disclosed to indicate the Group’s underlying profitability. It is defined as profit before amortisation and
impairment of acquisition intangibles, impairment of goodwill, acquisition expenses, adjustments to contingent consideration,
exceptional items, financing fair value remeasurements, tax and discontinued operations. It includes the Group’s share of continuing
associates’ pre-tax results.
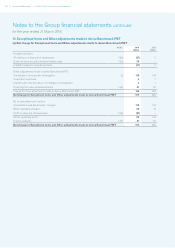
An explanation of the basis on which Experian reports exceptional items is provided below. Other adjustments made to derive
Benchmark PBT are explained as follows:
• Charges for the amortisation and impairment of acquisition intangibles are excluded from the definition of Benchmark PBT
because these charges are based on judgments about their value and economic life. Impairment of goodwill is similarly excluded.
• Acquisition expenses relating to successful, active or aborted acquisitions are excluded from the definition of Benchmark PBT as
they bear no relation to the Group’s underlying performance or to the performance of any acquired businesses. Adjustments to
contingent consideration are similarly excluded.
• Charges and credits for financing fair value remeasurements within finance expense in the Group income statement are
excluded from the definition of Benchmark PBT. These include that element of the Group’s derivatives that is ineligible for hedge
accounting together with gains and losses on put options in respect of acquisitions. Amounts recognised generally arise from
market movements and accordingly bear no direct relation to the Group’s underlying performance.
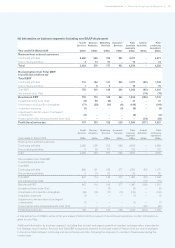
(b) Earnings before interest and tax (‘Total EBIT’ and ‘EBIT’)
Total EBIT is defined as Benchmark PBT before the net interest expense charged therein. Total EBIT excluding the results of
discontinuing activities is defined and reported as EBIT.
(c) Earnings before interest, tax, depreciation and amortisation (‘EBITDA’)
EBITDA is defined as Total EBIT before the depreciation and amortisation charged therein.
(d) Continuing activities and Discontinuing activities
Businesses trading at 31 March 2016, which are not disclosed as discontinuing activities, are treated as continuing activities.
Discontinuing activities are businesses sold, closed or identified for closure during a financial year. These are treated as
discontinuing activities for both revenue and EBIT purposes. The results of discontinuing activities are disclosed separately with the
results of the prior period re-presented as appropriate. This measure differs from the definition of discontinued operations in IFRS 5.
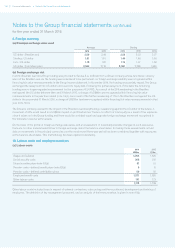
(e) Constant exchange rates
To highlight its organic performance, Experian discusses its results in terms of growth at constant exchange rates, unless otherwise
stated. This represents growth calculated after translating both years’ performance at the prior year’s average exchange rates.
(f) Total growth
This is the year-on-year change in the performance of Experian’s activities. Total growth at constant exchange rates removes the
translational foreign exchange effects arising on the consolidation of Experian’s activities.
(g) Organic revenue growth
This is the year-on-year change in the revenue of continuing activities, translated at constant exchange rates, excluding acquisitions
until the first anniversary of their consolidation.