Experian 2016 Annual Report Download - page 33
Download and view the complete annual report
Please find page 33 of the 2016 Experian annual report below. You can navigate through the pages in the report by either clicking on the pages listed below, or by using the keyword search tool below to find specific information within the annual report.-
 1
1 -
2
-
3
-
4
-
5
-
6
-
7
-
8
-
9
-
10
-
11
-
12
-
13
-
14
-
15
-
16
-
17
-
18
-
19
-
20
-
21
-
22
-
 23
23 -
 24
24 -
 25
25 -
 26
26 -
 27
27 -
 28
28 -
 29
29 -
 30
30 -
 31
31 -
 32
32 -
 33
33 -
 34
34 -
 35
35 -
 36
36 -
 37
37 -
 38
38 -
 39
39 -
 40
40 -
 41
41 -
 42
42 -
 43
43 -
44
-
45
-
46
-
47
-
48
-
49
-
50
-
51
-
52
-
53
-
54
-
55
-
56
-
57
-
58
-
59
-
60
-
61
-
62
-
63
-
64
-
65
-
66
-
67
-
68
-
69
-
70
-
71
-
72
-
73
-
74
-
75
-
76
-
77
-
78
-
79
-
80
-
81
-
82
-
83
-
84
-
85
-
86
-
87
-
88
-
89
-
90
-
91
-
92
-
93
-
94
-
95
-
96
-
97
-
98
-
99
-
100
-
101
-
102
-
103
-
104
-
105
-
106
-
107
-
108
-
109
-
110
-
111
-
112
-
113
-
114
-
115
-
116
-
117
-
118
-
119
-
120
-
121
-
122
-
123
-
124
-
125
-
126
-
127
-
128
-
129
-
130
-
131
-
132
-
133
-
134
-
135
-
136
-
137
-
138
-
139
-
140
-
141
-
142
-
143
-
144
-
145
-
146
-
147
-
148
-
149
-
150
-
151
-
152
-
153
-
154
-
155
-
156
-
157
-
158
-
159
-
160
-
161
-
162
-
163
-
164
-
165
-
166
-
167
-
168
-
169
-
170
-
171
-
172
-
173
-
174
-
175
-
176
-
177
-
178
-
179
-
180
-
181
-
182
-
183
-
184
-
185
-
186
-
187
-
188
 |
 |
31
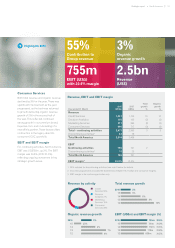
55% 3%
Contribution to
Group revenue
Organic
revenue growth
755m
EBIT (US$)
with 30.6% margin
2.5bn
Revenue
(US$)
Revenue, EBIT and EBIT margin
755m
741m
757m
718m
658m
Revenue by activity
Credit
Services 50%
Decision
Analytics 7%
Marketing
Services 15%
Consumer
Services 28%
(2)%
4%
3%
6%
2016 2016
2016
15 15
15
14 14
14
13 13
13
12 12
12
3%
3%
Total revenue growth
Organic revenue growth EBIT (US$m) and EBIT margin (%)
7%
Year ended 31 March
2016
US$m
20151
US$m
Total
growth
%
Organic
growth
%
Revenue
Credit Services 1,237 1,125 10 10
Decision Analytics 161 165 (2) (2)
Marketing Services 377 383 (2) (2)
Consumer Services 696 717 (3) (3)
Total – continuing activities 2,471 2,390 3 3
Discontinuing activities243 78
Total North America 2,514 2,468
EBIT
Continuing activities 755 741 2
Discontinuing activities211 20
Total North America 766 761
EBIT margin330.6% 31.0%
1 2015 restated for discontinuing activities (see note 2 below for details).
2 Discontinuing activities includes the divestments of Baker Hill, Footfall and Consumer Insights.
3 EBIT margin is for continuing activities only.
Consumer Services
Both total revenue and organic revenue
declined by 3% for the year. There was
significant improvement as the year
progressed, as the business returned
to growth delivering organic revenue
growth of 2% in the second half of
the year. This reflected continued
strong growth in our premium brand,
Experian.com, and on-boarding of a
new affinity partner. These factors offset
contraction in the legacy direct-to-
consumer (‘D2C’) portfolio.
EBIT and EBIT margin
For continuing activities, North America
EBIT was US$755m, up 2%. The EBIT
margin was 30.6% (2015: 31.0%),
reflecting ongoing investment in key
strategic growth areas.
6%
8%
10%
30.6%
31.5%
31.0%
31.8%
31.5%
Highlights 2016
Strategic report •North America