Experian 2016 Annual Report Download - page 136
Download and view the complete annual report
Please find page 136 of the 2016 Experian annual report below. You can navigate through the pages in the report by either clicking on the pages listed below, or by using the keyword search tool below to find specific information within the annual report.-
 1
1 -
2
-
3
-
4
-
5
-
6
-
7
-
8
-
9
-
10
-
11
-
12
-
13
-
14
-
15
-
16
-
17
-
18
-
19
-
20
-
21
-
22
-
23
-
24
-
25
-
26
-
27
-
28
-
29
-
30
-
31
-
32
-
33
-
34
-
35
-
36
-
37
-
38
-
39
-
40
-
41
-
42
-
43
-
44
-
45
-
46
-
47
-
48
-
49
-
50
-
51
-
52
-
53
-
54
-
55
-
56
-
57
-
58
-
59
-
60
-
61
-
62
-
63
-
64
-
65
-
66
-
67
-
68
-
69
-
70
-
71
-
72
-
73
-
74
-
75
-
76
-
77
-
78
-
79
-
80
-
81
-
82
-
83
-
84
-
85
-
86
-
87
-
88
-
89
-
90
-
91
-
92
-
93
-
94
-
95
-
96
-
97
-
98
-
99
-
100
-
101
-
102
-
103
-
104
-
105
-
106
-
107
-
108
-
109
-
110
-
111
-
112
-
113
-
114
-
115
-
116
-
117
-
118
-
119
-
120
-
121
-
122
-
123
-
124
-
125
-
 126
126 -
 127
127 -
 128
128 -
 129
129 -
 130
130 -
 131
131 -
 132
132 -
 133
133 -
 134
134 -
 135
135 -
 136
136 -
 137
137 -
 138
138 -
 139
139 -
 140
140 -
 141
141 -
 142
142 -
 143
143 -
 144
144 -
 145
145 -
 146
146 -
147
-
148
-
149
-
150
-
151
-
152
-
153
-
154
-
155
-
156
-
157
-
158
-
159
-
160
-
161
-
162
-
163
-
164
-
165
-
166
-
167
-
168
-
169
-
170
-
171
-
172
-
173
-
174
-
175
-
176
-
177
-
178
-
179
-
180
-
181
-
182
-
183
-
184
-
185
-
186
-
187
-
188
 |
 |

134
Notes to the Group financial statements continued
for the year ended 31 March 2016
Financial statements •Notes to the Group nancial statements
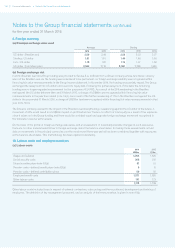
9. Foreign currency
(a) Principal exchange rates used
Average Closing
2016 2015 2016 2015 2014
US dollar : Brazilian real 3.59 2.48 3.56 3.22 2.27
Sterling : US dollar 1.51 1.61 1.44 1.48 1.66
Euro : US dollar 1.10 1.26 1.14 1.07 1.38
US dollar : Colombian peso 2,942 2,118 2,997 2,596 1,966
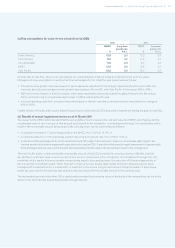
(b) Foreign exchange risk
In 2012, Brazilian real intra-Group funding was provided to Serasa S.A. in Brazil from a Group company whose functional currency
was not the Brazilian real. As the funding was considered to be permanent, no foreign exchange volatility was recognised within
financing fair value remeasurements in the Group income statement. In November 2014, the funding was partially repaid. The Group
exchanged the repayment into US dollars and used it to repay debt. Following the partial repayment of the debt, the remaining
funding was no longer regarded as permanent for the purposes of EU-IFRS. As a result of the 25% weakening in the Brazilian
real against the US dollar between then and 31 March 2015, a charge of US$86m was recognised within financing fair value
remeasurements in the year then ended (note 14(c)). As a result of the further weakening of 11% in the Brazilian real against the US
dollar in the year ended 31 March 2016, a charge of US$33m has been recognised within financing fair value remeasurements in that
year (note 14(c)).
The Group is similarly exposed to the impact of the Brazilian real strengthening or weakening against the US dollar in the future. A
movement of 23% would result in a US$68m impact on profit before tax. There is no effect on total equity as a result of this exposure,
since it arises on intra-Group funding and there would be a related equal and opposite foreign exchange movement recognised in
the translation reserve within equity.
On the basis of the profile of foreign exchange exposures, and an assessment of reasonably possible changes in such exposures,
there are no other material sensitivities to foreign exchange risk at the balance sheet dates. In making these assessments, actual
data on movements in the principal currencies over the most recent three-year period has been considered together with exposures
at the balance sheet dates. This methodology has been applied consistently.
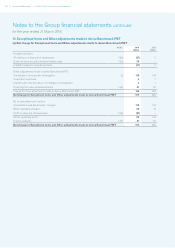
10. Labour costs and employee numbers
(a) Labour costs
2016
US$m
2015
US$m
Wages and salaries 1,253 1,305
Social security costs 202 210
Share incentive plans (note 30(a)) 57 51
Pension costs – defined benefit plans (note 32(a)) 9 10
Pension costs – defined contribution plans 50 50
Employee benefit costs 1,571 1,626
Other labour costs 141 173
1,712 1,799
Other labour costs includes those in respect of external contractors, outsourcing and the recruitment, development and training of
employees. The definition of key management personnel, and an analysis of their remuneration, is given in note 41(d).