Experian 2016 Annual Report Download - page 29
Download and view the complete annual report
Please find page 29 of the 2016 Experian annual report below. You can navigate through the pages in the report by either clicking on the pages listed below, or by using the keyword search tool below to find specific information within the annual report.-
 1
1 -
2
-
3
-
4
-
5
-
6
-
7
-
8
-
9
-
10
-
11
-
12
-
13
-
14
-
15
-
16
-
17
-
18
-
 19
19 -
 20
20 -
 21
21 -
 22
22 -
 23
23 -
 24
24 -
 25
25 -
 26
26 -
 27
27 -
 28
28 -
 29
29 -
 30
30 -
 31
31 -
 32
32 -
 33
33 -
 34
34 -
 35
35 -
 36
36 -
 37
37 -
 38
38 -
 39
39 -
40
-
41
-
42
-
43
-
44
-
45
-
46
-
47
-
48
-
49
-
50
-
51
-
52
-
53
-
54
-
55
-
56
-
57
-
58
-
59
-
60
-
61
-
62
-
63
-
64
-
65
-
66
-
67
-
68
-
69
-
70
-
71
-
72
-
73
-
74
-
75
-
76
-
77
-
78
-
79
-
80
-
81
-
82
-
83
-
84
-
85
-
86
-
87
-
88
-
89
-
90
-
91
-
92
-
93
-
94
-
95
-
96
-
97
-
98
-
99
-
100
-
101
-
102
-
103
-
104
-
105
-
106
-
107
-
108
-
109
-
110
-
111
-
112
-
113
-
114
-
115
-
116
-
117
-
118
-
119
-
120
-
121
-
122
-
123
-
124
-
125
-
126
-
127
-
128
-
129
-
130
-
131
-
132
-
133
-
134
-
135
-
136
-
137
-
138
-
139
-
140
-
141
-
142
-
143
-
144
-
145
-
146
-
147
-
148
-
149
-
150
-
151
-
152
-
153
-
154
-
155
-
156
-
157
-
158
-
159
-
160
-
161
-
162
-
163
-
164
-
165
-
166
-
167
-
168
-
169
-
170
-
171
-
172
-
173
-
174
-
175
-
176
-
177
-
178
-
179
-
180
-
181
-
182
-
183
-
184
-
185
-
186
-
187
-
188
 |
 |

27
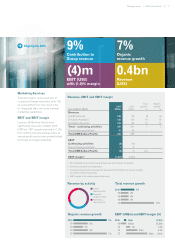
Highlights 2016
Revenue and EBIT by region, EBIT margin
2016
US$m
20151
US$m
Total growth2
%
Organic growth
2
%
Revenue
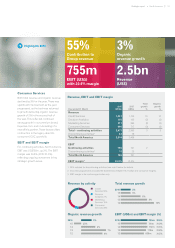
North America 2,471 2,390 3 3
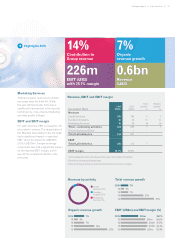
Latin America 633 856 7 7
UK and Ireland 956 971 5 5
EMEA/Asia Pacific 417 441 7 7
Total – continuing activities 4,477 4,658 5 5
Discontinuing activities³ 73 152
Total 4,550 4,810
EBIT
North America 755 741 2
Latin America 226 313 7
UK and Ireland 300 308 4
EMEA/Asia Pacific (4) (10) n/a
Sub-total 1,277 1,352 5
Central Activities – central corporate costs (82) (81) n/a
Continuing activities 1,195 1,271 5
Discontinuing activities³ 15 35 n/a
Total EBIT 1,210 1,306 3
EBIT margin – continuing activities 26.7% 27.3%
1 2015 restated for discontinuing activities (see note 3 below for details).
2 At constant exchange rates.
3 Discontinuing activities comprise Baker Hill (North America), FootFall (North America, UK and Ireland, and EMEA/Asia Pacific),
Consumer Insights (all regions) and other small businesses in EMEA/Asia Pacific.
See the Financial review for analysis of revenue, EBIT and EBIT margin by business segment and note 6 to the Group financial statements
for definitions of non-GAAP measures.
26.7%
EBIT margin
5%
Total and organic
revenue growth
Strategic report •Chief Executive’s review