Experian 2016 Annual Report Download - page 173
Download and view the complete annual report
Please find page 173 of the 2016 Experian annual report below. You can navigate through the pages in the report by either clicking on the pages listed below, or by using the keyword search tool below to find specific information within the annual report.-
 1
1 -
2
-
3
-
4
-
5
-
6
-
7
-
8
-
9
-
10
-
11
-
12
-
13
-
14
-
15
-
16
-
17
-
18
-
19
-
20
-
21
-
22
-
23
-
24
-
25
-
26
-
27
-
28
-
29
-
30
-
31
-
32
-
33
-
34
-
35
-
36
-
37
-
38
-
39
-
40
-
41
-
42
-
43
-
44
-
45
-
46
-
47
-
48
-
49
-
50
-
51
-
52
-
53
-
54
-
55
-
56
-
57
-
58
-
59
-
60
-
61
-
62
-
63
-
64
-
65
-
66
-
67
-
68
-
69
-
70
-
71
-
72
-
73
-
74
-
75
-
76
-
77
-
78
-
79
-
80
-
81
-
82
-
83
-
84
-
85
-
86
-
87
-
88
-
89
-
90
-
91
-
92
-
93
-
94
-
95
-
96
-
97
-
98
-
99
-
100
-
101
-
102
-
103
-
104
-
105
-
106
-
107
-
108
-
109
-
110
-
111
-
112
-
113
-
114
-
115
-
116
-
117
-
118
-
119
-
120
-
121
-
122
-
123
-
124
-
125
-
126
-
127
-
128
-
129
-
130
-
131
-
132
-
133
-
134
-
135
-
136
-
137
-
138
-
139
-
140
-
141
-
142
-
143
-
144
-
145
-
146
-
147
-
148
-
149
-
150
-
151
-
152
-
153
-
154
-
155
-
156
-
157
-
158
-
159
-
160
-
161
-
162
-
 163
163 -
 164
164 -
 165
165 -
 166
166 -
 167
167 -
 168
168 -
 169
169 -
 170
170 -
 171
171 -
 172
172 -
 173
173 -
 174
174 -
 175
175 -
 176
176 -
 177
177 -
 178
178 -
 179
179 -
 180
180 -
 181
181 -
 182
182 -
 183
183 -
184
-
185
-
186
-
187
-
188
 |
 |

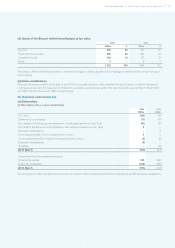
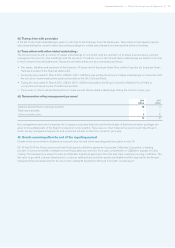
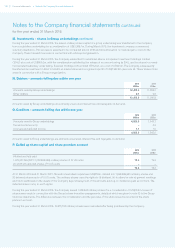
171•Financial statements Company nancial statements
Called
up share
capital
(Note P)
US$m
Share
premium
account
(Note P)
US$m
Profit and loss account reserve Tot al e quity
US$m
Profit and
loss account
US$m
Own
shares
reserve
US$m
Total
(Note Q)
US$m
At 1 April 2015 79.3 1,177.0 14,746.7 (874.5) 13,872.2 15,128.5
Loss for the financial year – – (12.3) –(12.3) (12.3)
Other comprehensive income for the financial year – – – – – –
Total comprehensive income for the financial year – – (12.3) –(12.3) (12.3)
Transactions with owners:
Employee share incentive plans:
– value of employee services – – 54.3 –54.3 54.3
– shares issued on vesting 0.1 12.7 – – – 12.8
– other exercises of share awards and options – – (79.1) 79.2 0.1 0.1
– purchase of shares by employee trusts – – – (71.4) (71.4) (71.4)
– other payments – – (0.1) –(0.1) (0.1)
Purchase of shares held as treasury shares – – – (342.8) (342.8) (342.8)
Purchase and cancellation of own shares (1.1) –(189.2) –(189.2) (190.3)
Fair value (gain)/loss on commitments to purchase own shares ––(2.5) 0.3 (2.2) (2.2)
Dividends paid – – (27.7) –(27.7) (27.7)
Transactions with owners (1.0) 12.7 (244.3) (334.7) (579.0) (567.3)
At 31 March 2016 78.3 1,189.7 14,490.1 (1,209.2) 13,280.9 14,548.9
Called
up share
capital
(Note P)
US$m
Share
premium
account
(Note P)
US$m
Profit and loss account reserve Total equity
US$m
Profit and
loss account
US$m
Own
shares
reserve
US$m
Total
(Note Q)
US$m
At 1 April 2014 79.2 1,163.2 6,923.1 (778.2) 6,14 4.9 7,387.3
Profit for the financial year – – 7,904.8 –7,904.8 7,904.8
Other comprehensive income for the financial year – – – – – –
Total comprehensive income for the financial year – – 7,904.8 –7,904.8 7,904.8
Transactions with owners:
Employee share incentive plans:
– value of employee services – – 47.3 –47.3 47.3
– shares issued on vesting 0.1 13.8 ––– 13.9
– other exercises of share awards and options – – (105.5) 111.7 6.2 6.2
– purchase of shares by employee trusts – – (4.3) (37.8) (42.1) (42.1)
Purchase of shares held as treasury shares – – – (170.2) (170.2) (170.2)
Dividends paid – – (18.7) –(18.7) (18.7)
Transactions with owners 0.1 13.8 (81.2) (96.3) (177.5) (163.6)
At 31 March 2015 79.3 1,177.0 14,746.7 (874.5) 13,872.2 15,128.5
Company statement of changes in total equity
for the year ended 31 March 2016