Experian 2016 Annual Report Download - page 172
Download and view the complete annual report
Please find page 172 of the 2016 Experian annual report below. You can navigate through the pages in the report by either clicking on the pages listed below, or by using the keyword search tool below to find specific information within the annual report.-
 1
1 -
2
-
3
-
4
-
5
-
6
-
7
-
8
-
9
-
10
-
11
-
12
-
13
-
14
-
15
-
16
-
17
-
18
-
19
-
20
-
21
-
22
-
23
-
24
-
25
-
26
-
27
-
28
-
29
-
30
-
31
-
32
-
33
-
34
-
35
-
36
-
37
-
38
-
39
-
40
-
41
-
42
-
43
-
44
-
45
-
46
-
47
-
48
-
49
-
50
-
51
-
52
-
53
-
54
-
55
-
56
-
57
-
58
-
59
-
60
-
61
-
62
-
63
-
64
-
65
-
66
-
67
-
68
-
69
-
70
-
71
-
72
-
73
-
74
-
75
-
76
-
77
-
78
-
79
-
80
-
81
-
82
-
83
-
84
-
85
-
86
-
87
-
88
-
89
-
90
-
91
-
92
-
93
-
94
-
95
-
96
-
97
-
98
-
99
-
100
-
101
-
102
-
103
-
104
-
105
-
106
-
107
-
108
-
109
-
110
-
111
-
112
-
113
-
114
-
115
-
116
-
117
-
118
-
119
-
120
-
121
-
122
-
123
-
124
-
125
-
126
-
127
-
128
-
129
-
130
-
131
-
132
-
133
-
134
-
135
-
136
-
137
-
138
-
139
-
140
-
141
-
142
-
143
-
144
-
145
-
146
-
147
-
148
-
149
-
150
-
151
-
152
-
153
-
154
-
155
-
156
-
157
-
158
-
159
-
160
-
161
-
 162
162 -
 163
163 -
 164
164 -
 165
165 -
 166
166 -
 167
167 -
 168
168 -
 169
169 -
 170
170 -
 171
171 -
 172
172 -
 173
173 -
 174
174 -
 175
175 -
 176
176 -
 177
177 -
 178
178 -
 179
179 -
 180
180 -
 181
181 -
 182
182 -
183
-
184
-
185
-
186
-
187
-
188
 |
 |

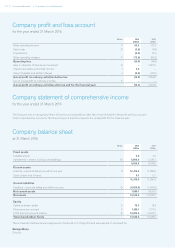
170 Financial statements •Company nancial statements
Notes 2016
US$m
2015
US$m
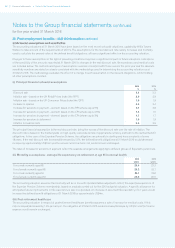
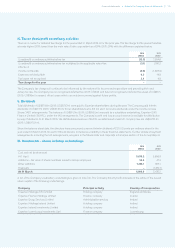
Other operating income F62.4 67.3
Staff costs G(3.6) (3.9)
Depreciation (0.2) (0.2)
Other operating charges F(72.6) (82.8)
Operating loss (14.0) (19.6)
Gain on disposal of fixed asset investment H– 7,967.9
Interest receivable and similar income I2.5 –
Interest payable and similar charges J(0.8) (43.5)
(Loss)/profit on ordinary activities before tax (12.3) 7,904.8
Tax on (loss)/profit on ordinary activities K– –
(Loss)/profit on ordinary activities after tax and for the financial year (12.3) 7,904.8
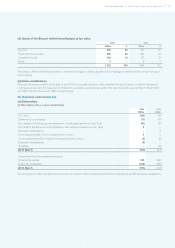
Company statement of comprehensive income
for the year ended 31 March 2016
The Company has no recognised items of income and expenditure other than those included in the profit and loss account.
Total comprehensive income for the financial year is therefore equal to the (loss)/profit for the financial year.
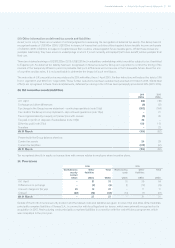
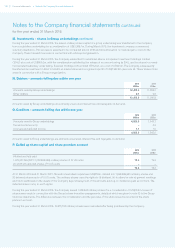
Company balance sheet
at 31 March 2016
Notes 2016
US$m
2015
US$m
Fixed assets
Tangible assets 0.2 0.4
Investments – shares in Group undertakings M6,898.6 5,476.2
6,898.8 5,476.6
Current assets
Debtors – amounts falling due within one year N12,478.5 11, 29 6.8
Cash at bank and in hand 0.1 0.1
12,478.6 11,296.9
Current liabilities
Creditors – amounts falling due within one year O(4,828.5) (1,645.0)
Net current assets 7,650.1 9,651.9
Net assets 14,548.9 15,128.5
Equity
Called up share capital P78.3 79.3
Share premium account P1,189.7 1,177.0
Profit and loss account reserve Q13,280.9 13,872.2
Total shareholders’ funds 14,548.9 15,128.5
These financial statements were approved by the Board on 10 May 2016 and were signed on its behalf by:
George Rose
Director
Company profit and loss account
for the year ended 31 March 2016