Experian 2016 Annual Report Download - page 41
Download and view the complete annual report
Please find page 41 of the 2016 Experian annual report below. You can navigate through the pages in the report by either clicking on the pages listed below, or by using the keyword search tool below to find specific information within the annual report.-
 1
1 -
2
-
3
-
4
-
5
-
6
-
7
-
8
-
9
-
10
-
11
-
12
-
13
-
14
-
15
-
16
-
17
-
18
-
19
-
20
-
21
-
22
-
23
-
24
-
25
-
26
-
27
-
28
-
29
-
30
-
 31
31 -
 32
32 -
 33
33 -
 34
34 -
 35
35 -
 36
36 -
 37
37 -
 38
38 -
 39
39 -
 40
40 -
 41
41 -
 42
42 -
 43
43 -
 44
44 -
 45
45 -
 46
46 -
 47
47 -
 48
48 -
 49
49 -
 50
50 -
 51
51 -
52
-
53
-
54
-
55
-
56
-
57
-
58
-
59
-
60
-
61
-
62
-
63
-
64
-
65
-
66
-
67
-
68
-
69
-
70
-
71
-
72
-
73
-
74
-
75
-
76
-
77
-
78
-
79
-
80
-
81
-
82
-
83
-
84
-
85
-
86
-
87
-
88
-
89
-
90
-
91
-
92
-
93
-
94
-
95
-
96
-
97
-
98
-
99
-
100
-
101
-
102
-
103
-
104
-
105
-
106
-
107
-
108
-
109
-
110
-
111
-
112
-
113
-
114
-
115
-
116
-
117
-
118
-
119
-
120
-
121
-
122
-
123
-
124
-
125
-
126
-
127
-
128
-
129
-
130
-
131
-
132
-
133
-
134
-
135
-
136
-
137
-
138
-
139
-
140
-
141
-
142
-
143
-
144
-
145
-
146
-
147
-
148
-
149
-
150
-
151
-
152
-
153
-
154
-
155
-
156
-
157
-
158
-
159
-
160
-
161
-
162
-
163
-
164
-
165
-
166
-
167
-
168
-
169
-
170
-
171
-
172
-
173
-
174
-
175
-
176
-
177
-
178
-
179
-
180
-
181
-
182
-
183
-
184
-
185
-
186
-
187
-
188
 |
 |
39
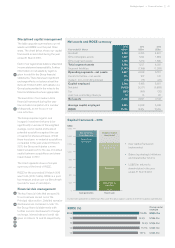
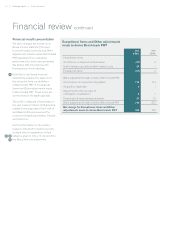
together with the very strong cash flow
performance. The Benchmark tax rate
was 24.9% (2015: 24.4%).
The Group continued to deliver strong
cash generation, with a 105% conversion
of Total EBIT to operating cash flow
(2015: 104%). Investment activity in the
year has been undertaken within the
capital allocation framework outlined
last year and has been primarily organic.
The Group has continued to focus its
portfolio, making six disposals for total
cash receipts of US$214m.
Shareholder returns
The Group extended its previously
announced US$600m share
purchase programme to US$800m.
At 31 March 2016 US$656m of this
programme had been completed.
The second interim dividend is 27.50
(2015: 27.00) US cents per share
giving a total dividend for the year
of 40.00 (2015: 39.25) US cents per
share, an increase of 2.0%. This
reflects the underlying strength of the
business, notwithstanding the foreign
exchange headwinds.
Taking the total dividend and share
purchases together, during the year
the Group returned a total of US$972m
to shareholders.
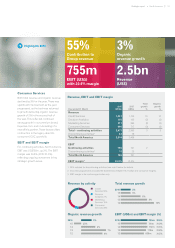
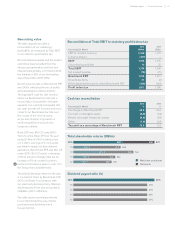
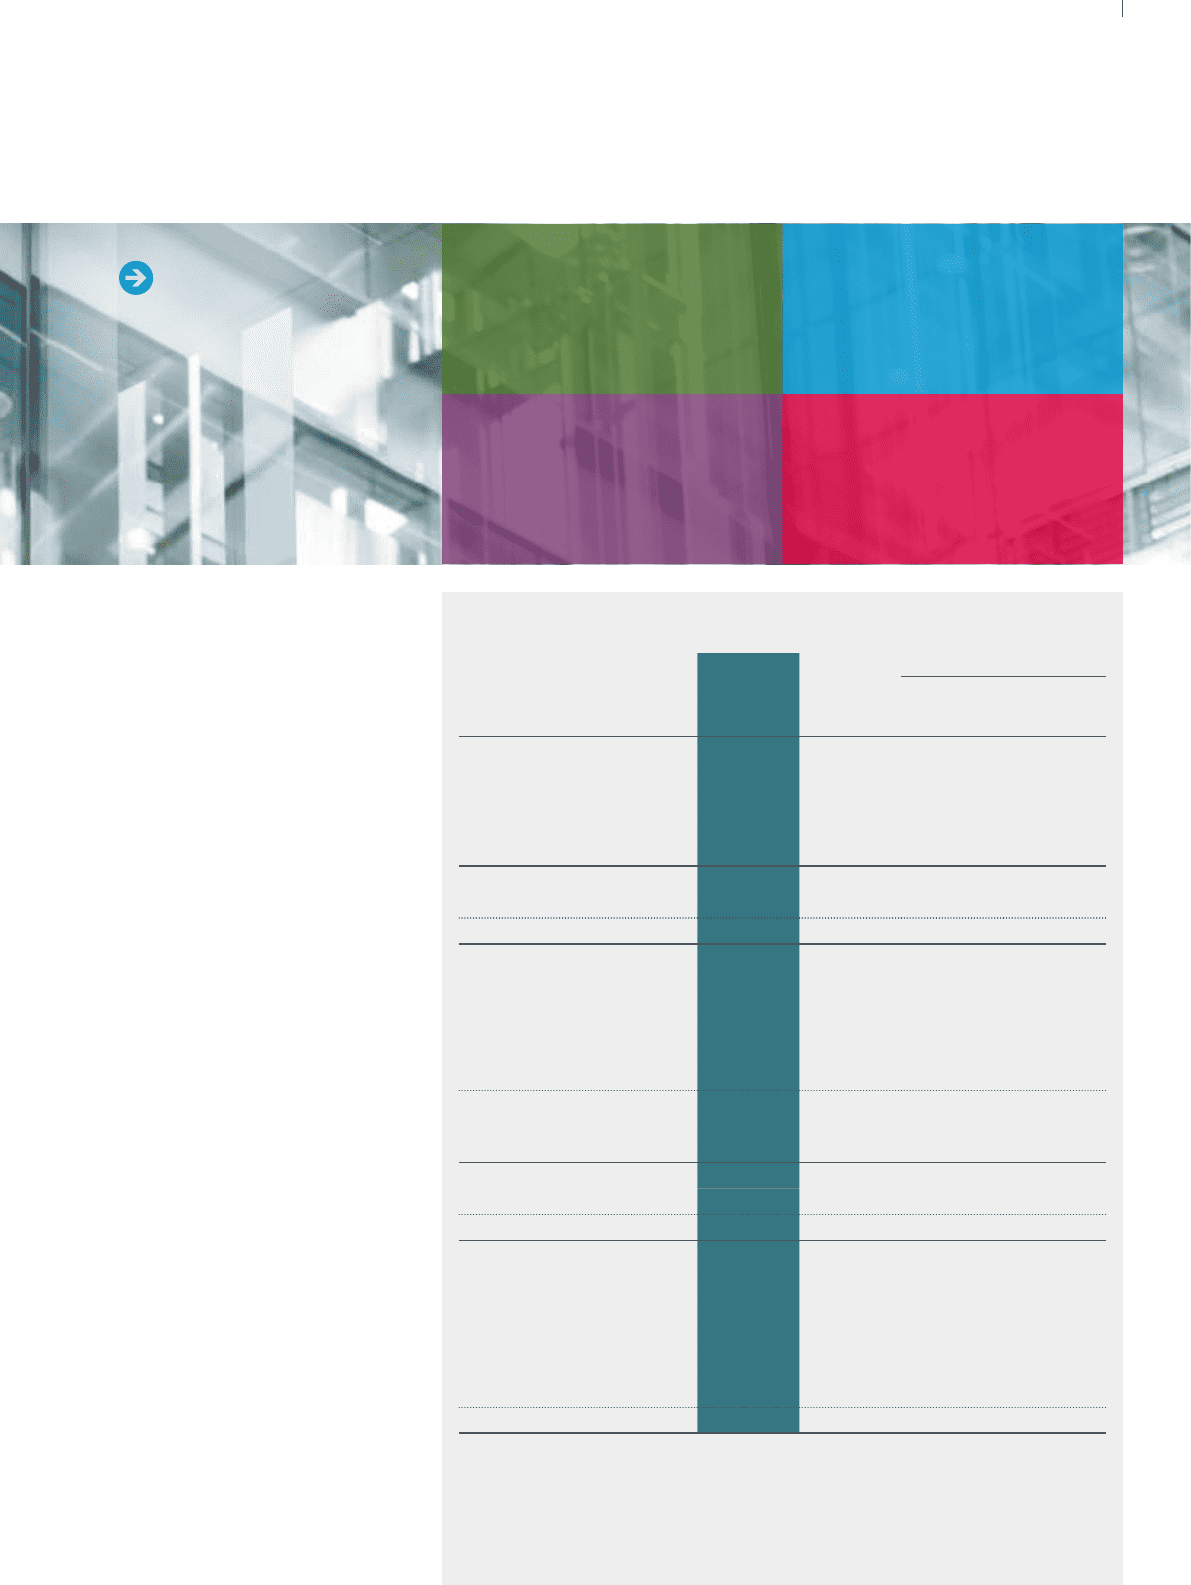
Revenue, Total EBIT and EBIT margin by business segment
Year ended 31 March
2016
US$m
20151
US$m
Growth %
Total at
constant
rates
Organic at
constant
rates
Revenue
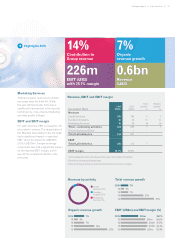
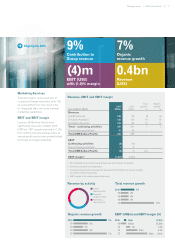
Credit Services 2,240 2,360 8 8
Decision Analytics 566 565 9 9
Marketing Services 720 753 1 –
Consumer Services 951 980 (1) (1)
Continuing activities 4,477 4,658 5 5
Discontinuing activities273 152 n/a
Total 4,550 4,810 3
Total EBIT
Credit Services 791 845 6
Decision Analytics 104 101 17
Marketing Services 141 129 16
Consumer Services 241 277 (11)
Business segments 1,277 1,352 5
Central Activities –
central corporate costs (82) (81) (4)
Continuing activities 1,195 1,271 5
Discontinuing activities215 35 n/a
Total EBIT 1,210 1,306 3
EBIT margin –
continuing activities3
Credit Services 35.3% 35.8% (0.4%)
Decision Analytics 18.4% 17.9% 1.3%
Marketing Services 19.6% 17.1% 2.6%
Consumer Services 25.3% 28.3% (2.8%)
EBIT margin 26.7% 27.3% –
1 2015 restated for the divestment of Baker Hill, FootFall, Consumer Insights and other small
businesses and their movement to discontinuing activities within the relevant business segments.
2 Discontinuing activities comprise discontinuing Credit Services, Decision Analytics and Marketing
Services businesses.
3 The growth percentages at constant currency for EBIT margin show the margin change at constant
exchange rates.
4,477m
Revenue (US$)
89.1
Benchmark EPS
(USc)
5%
Organic revenue
growth (%)
972m
Total shareholder
returns (US$)
Highlights 2016
Strategic report •Financial review