Experian 2016 Annual Report Download - page 148
Download and view the complete annual report
Please find page 148 of the 2016 Experian annual report below. You can navigate through the pages in the report by either clicking on the pages listed below, or by using the keyword search tool below to find specific information within the annual report.-
 1
1 -
2
-
3
-
4
-
5
-
6
-
7
-
8
-
9
-
10
-
11
-
12
-
13
-
14
-
15
-
16
-
17
-
18
-
19
-
20
-
21
-
22
-
23
-
24
-
25
-
26
-
27
-
28
-
29
-
30
-
31
-
32
-
33
-
34
-
35
-
36
-
37
-
38
-
39
-
40
-
41
-
42
-
43
-
44
-
45
-
46
-
47
-
48
-
49
-
50
-
51
-
52
-
53
-
54
-
55
-
56
-
57
-
58
-
59
-
60
-
61
-
62
-
63
-
64
-
65
-
66
-
67
-
68
-
69
-
70
-
71
-
72
-
73
-
74
-
75
-
76
-
77
-
78
-
79
-
80
-
81
-
82
-
83
-
84
-
85
-
86
-
87
-
88
-
89
-
90
-
91
-
92
-
93
-
94
-
95
-
96
-
97
-
98
-
99
-
100
-
101
-
102
-
103
-
104
-
105
-
106
-
107
-
108
-
109
-
110
-
111
-
112
-
113
-
114
-
115
-
116
-
117
-
118
-
119
-
120
-
121
-
122
-
123
-
124
-
125
-
126
-
127
-
128
-
129
-
130
-
131
-
132
-
133
-
134
-
135
-
136
-
137
-
 138
138 -
 139
139 -
 140
140 -
 141
141 -
 142
142 -
 143
143 -
 144
144 -
 145
145 -
 146
146 -
 147
147 -
 148
148 -
 149
149 -
 150
150 -
 151
151 -
 152
152 -
 153
153 -
 154
154 -
 155
155 -
 156
156 -
 157
157 -
 158
158 -
159
-
160
-
161
-
162
-
163
-
164
-
165
-
166
-
167
-
168
-
169
-
170
-
171
-
172
-
173
-
174
-
175
-
176
-
177
-
178
-
179
-
180
-
181
-
182
-
183
-
184
-
185
-
186
-
187
-
188
 |
 |

146
Notes to the Group financial statements continued
for the year ended 31 March 2016
Financial statements •Notes to the Group nancial statements
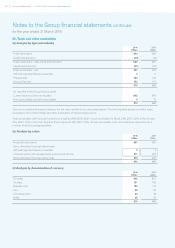
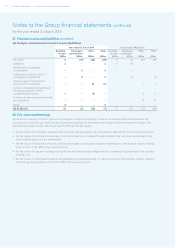
22. Trade and other receivables
(a) Analysis by type and maturity
2016
US$m
2015
US$m
Trade receivables 614 668
Credit note provision (12) (14)
Trade receivables – after credit note provision 602 654
Impairment provision (21) (25)
Trade receivables – net 581 629
VAT and equivalent taxes recoverable 2 2
Prepayments 164 120
Accrued income 163 137
910 888
As reported in the Group balance sheet:
Current trade and other receivables 902 878
Non-current trade and other receivables 8 10
910 888
There is no material difference between the fair value and the book value stated above. The only impaired assets are within trade
receivables. Non-current trade and other receivables comprise prepayments.
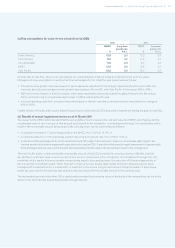
Trade receivables with financial institutions comprise 29% (2015: 32%) of such receivables in Brazil, 33% (2015: 30%) in the UK and
23% (2015: 17%) in the USA. Together these represent 22% (2015: 19%) of trade receivables, with other balances spread across a
number of sectors and geographies.
(b) Analysis by nature
2016
US$m
2015
US$m
Financial instruments 637 660
Items other than financial instruments:
VAT and equivalent taxes recoverable 2 2
Amounts within other prepayments and accrued income 271 226
Items other than financial instruments 273 228
910 888
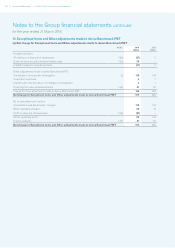
(c) Analysis by denomination of currency
2016
US$m
2015
US$m
US dollar 440 427
Sterling 181 193
Brazilian real 125 113
Euro 58 59
Colombian peso 20 18
Other 86 78
910 888