Experian 2016 Annual Report Download - page 137
Download and view the complete annual report
Please find page 137 of the 2016 Experian annual report below. You can navigate through the pages in the report by either clicking on the pages listed below, or by using the keyword search tool below to find specific information within the annual report.-
 1
1 -
2
-
3
-
4
-
5
-
6
-
7
-
8
-
9
-
10
-
11
-
12
-
13
-
14
-
15
-
16
-
17
-
18
-
19
-
20
-
21
-
22
-
23
-
24
-
25
-
26
-
27
-
28
-
29
-
30
-
31
-
32
-
33
-
34
-
35
-
36
-
37
-
38
-
39
-
40
-
41
-
42
-
43
-
44
-
45
-
46
-
47
-
48
-
49
-
50
-
51
-
52
-
53
-
54
-
55
-
56
-
57
-
58
-
59
-
60
-
61
-
62
-
63
-
64
-
65
-
66
-
67
-
68
-
69
-
70
-
71
-
72
-
73
-
74
-
75
-
76
-
77
-
78
-
79
-
80
-
81
-
82
-
83
-
84
-
85
-
86
-
87
-
88
-
89
-
90
-
91
-
92
-
93
-
94
-
95
-
96
-
97
-
98
-
99
-
100
-
101
-
102
-
103
-
104
-
105
-
106
-
107
-
108
-
109
-
110
-
111
-
112
-
113
-
114
-
115
-
116
-
117
-
118
-
119
-
120
-
121
-
122
-
123
-
124
-
125
-
126
-
 127
127 -
 128
128 -
 129
129 -
 130
130 -
 131
131 -
 132
132 -
 133
133 -
 134
134 -
 135
135 -
 136
136 -
 137
137 -
 138
138 -
 139
139 -
 140
140 -
 141
141 -
 142
142 -
 143
143 -
 144
144 -
 145
145 -
 146
146 -
 147
147 -
148
-
149
-
150
-
151
-
152
-
153
-
154
-
155
-
156
-
157
-
158
-
159
-
160
-
161
-
162
-
163
-
164
-
165
-
166
-
167
-
168
-
169
-
170
-
171
-
172
-
173
-
174
-
175
-
176
-
177
-
178
-
179
-
180
-
181
-
182
-
183
-
184
-
185
-
186
-
187
-
188
 |
 |

135•Notes to the Group nancial statementsFinancial statements
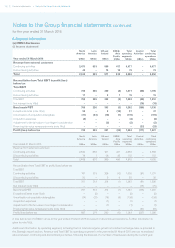
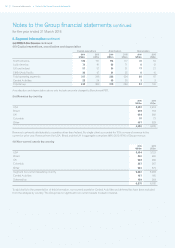
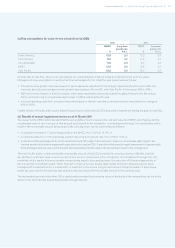
(b) Average monthly number of employees (including executive directors)
2016 2015
Full-time Part-time Full-time
equivalent
Full-time Part-time Full-time
equivalent
North America 6,626 48 6,650 6,663 56 6,691
Latin America 2,988 95 3,035 2,976 111 3,031
UK and Ireland 3,489 250 3,614 3,440 258 3,569
EMEA/Asia Pacific 3,172 101 3,223 3,178 101 3,229
Total operating segments 16,275 494 16,522 16,257 526 16,520
Central Activities 149 17 158 151 12 157
16,424 511 16,680 16,408 538 16,677
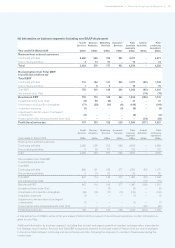
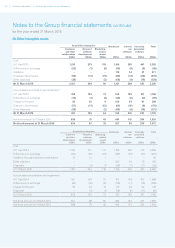
11. Amortisation and depreciation charges
2016
US$m
2015
US$m
Benchmark:
Amortisation of other intangible assets 270 284
Depreciation of property, plant and equipment 83 100
353 384
Non-benchmark:
Amortisation of acquisition intangibles 119 134
472 518
An analysis by segment of amounts charged within Benchmark PBT is given in note 8(a)(iii). Analyses by asset type are given in
notes 20 and 21.
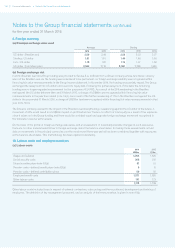
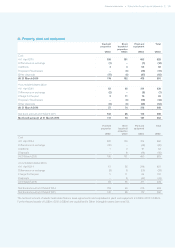
12. Fees payable to the Company’s auditor
2016
US$m
2015
US$m
Audit of the Company and Group financial statements 0.5 0.5
Audit of the financial statements of the Company’s subsidiaries 3.2 3.4
Tax compliance services 0.5 0.4
Tax advisory services 2.0 2.3
Audit-related assurance services 0.4 0.4
Other assurance services 0.3 0.1
Other services –0.9
Total fees payable to the Company’s auditor and its associates 6.9 8.0
Summary of fees by nature:
Fees for audit and assurance services 4.4 4.4
Fees for other services 2.5 3.6
Total fees payable to the Company’s auditor and its associates 6.9 8.0
The guidelines covering the use of the Company’s auditor for non-audit services are set out in the Corporate governance report.
In the year ended 31 March 2016, fees payable for such services, other than fees for audit-related assurance services, were 62%
(2015: 90%) of fees payable for audit services. Such fees are principally reported within other operating charges.