United Airlines 2010 Annual Report Download - page 95
Download and view the complete annual report
Please find page 95 of the 2010 United Airlines annual report below. You can navigate through the pages in the report by either clicking on the pages listed below, or by using the keyword search tool below to find specific information within the annual report.-
 1
1 -
2
-
3
-
4
-
5
-
6
-
7
-
8
-
9
-
10
-
11
-
12
-
13
-
14
-
15
-
16
-
17
-
18
-
19
-
20
-
21
-
22
-
23
-
24
-
25
-
26
-
27
-
28
-
29
-
30
-
31
-
32
-
33
-
34
-
35
-
36
-
37
-
38
-
39
-
40
-
41
-
42
-
43
-
44
-
45
-
46
-
47
-
48
-
49
-
50
-
51
-
52
-
53
-
54
-
55
-
56
-
57
-
58
-
59
-
60
-
61
-
62
-
63
-
64
-
65
-
66
-
67
-
68
-
69
-
70
-
71
-
72
-
73
-
74
-
75
-
76
-
77
-
78
-
79
-
80
-
81
-
82
-
83
-
84
-
 85
85 -
 86
86 -
 87
87 -
 88
88 -
 89
89 -
 90
90 -
 91
91 -
 92
92 -
 93
93 -
 94
94 -
 95
95 -
 96
96 -
 97
97 -
 98
98 -
 99
99 -
 100
100 -
 101
101 -
 102
102 -
 103
103 -
 104
104 -
 105
105 -
106
-
107
-
108
-
109
-
110
-
111
-
112
-
113
-
114
-
115
-
116
-
117
-
118
-
119
-
120
-
121
-
122
-
123
-
124
-
125
-
126
-
127
-
128
-
129
-
130
-
131
-
132
-
133
-
134
-
135
-
136
-
137
-
138
-
139
-
140
-
141
-
142
-
143
-
144
-
145
-
146
-
147
-
148
-
149
-
150
-
151
-
152
-
153
-
154
-
155
-
156
-
157
-
158
-
159
-
160
-
161
-
162
-
163
-
164
-
165
-
166
-
167
-
168
-
169
-
170
-
171
-
172
-
173
-
174
-
175
-
176
-
177
-
178
-
179
-
180
-
181
-
182
-
183
-
184
-
185
-
186
-
187
-
188
-
189
-
190
-
191
-
192
-
193
-
194
-
195
-
196
-
197
-
198
-
199
-
200
-
201
-
202
-
203
-
204
-
205
-
206
-
207
-
208
-
209
-
210
-
211
-
212
-
213
-
214
-
215
-
216
-
217
-
218
-
219
-
220
-
221
-
222
-
223
-
224
 |
 |

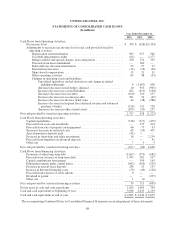
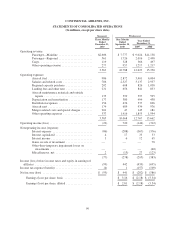
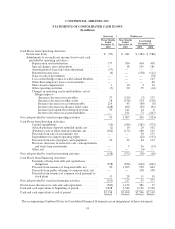
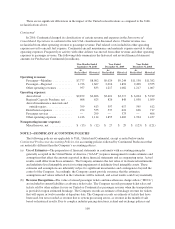
CONTINENTAL AIRLINES, INC.
STATEMENTS OF CONSOLIDATED CASH FLOWS
(In millions)
Successor Predecessor
Three Months
Ended
December 31,
2010
Nine Months
Ended
September 30,
2010
Year Ended
December 31,
2009 2008
Cash Flows from Operating Activities:
Net income (loss) .................................. $ (95) $ 441 $ (282) $ (586)
Adjustments to reconcile net income (loss) to net cash
provided by operating activities—
Depreciation and amortization .................... 177 380 494 438
Special charges, non-cash portion ................. — 18 145 181
Amortization of lease fair value adjustment ......... (57) — — —
Deferred income taxes .......................... (6) — (158) (111)
Gain on sale of investments ...................... — — — (78)
Loss on fuel hedge contracts with Lehman Brothers . . . — — — 125
Other-than-temporary losses on investments ......... — — — 60
Share-based compensation ....................... 1 10 9 16
Other operating activities ........................ (7) 20 55 (14)
Changes in operating assets and liabilities, net of
Merger impact—
(Increase) decrease in receivables ............. 37 (219) (3) 172
(Increase) decrease in other assets ............. 18 (158) 124 (226)
Increase (decrease) in accounts payable ........ 214 43 (69) (8)
Increase (decrease) in advance ticket sales ...... (248) 400 (50) (92)
Increase in frequent flyer deferred revenue ...... 59 141 24 6
Increase (decrease) in accrued liabilities ........ — 231 73 (207)
Net cash provided by (used in) operating activities ............ 93 1,307 362 (324)
Cash Flows from Investing Activities:
Capital expenditures ............................ (54) (246) (381) (373)
Aircraft purchase deposits refunded (paid), net ....... (2) 10 29 102
(Purchase) sale of short-term investments, net ....... (102) (171) 180 115
Proceeds from sale of investments, net ............. — — 30 171
Expenditures for airport operating rights ............ — — (22) (131)
Proceeds from sale of property and equipment ....... 20 32 64 113
Decrease (increase) in restricted cash, cash equivalents
and short-term investments .................... — 3 26 (13)
Other, net .................................... — — (4) —
Net cash provided by (used in) investing activities ............ (138) (372) (78) (16)
Cash Flows from Financing Activities:
Payments of long-term debt and capital lease
obligations ................................. (358) (836) (610) (641)
Proceeds from issuance of long-term debt, net ....... 90 1,025 538 642
Proceeds from public offering of common stock, net . . — — 158 358
Proceeds from issuance of common stock pursuant to
stock plans ................................. 13 28 11 18
Net cash provided by (used in) financing activities ............ (255) 217 97 377
Net increase (decrease) in cash and cash equivalents .......... (300) 1,152 381 37
Cash and cash equivalents at beginning of period ............. 3,698 2,546 2,165 2,128
Cash and cash equivalents at end of period .................. $3,398 $3,698 $2,546 $2,165
The accompanying Combined Notes to Consolidated Financial Statements are an integral part of these statements.
93