United Airlines 2010 Annual Report Download - page 42
Download and view the complete annual report
Please find page 42 of the 2010 United Airlines annual report below. You can navigate through the pages in the report by either clicking on the pages listed below, or by using the keyword search tool below to find specific information within the annual report.-
 1
1 -
2
-
3
-
4
-
5
-
6
-
7
-
8
-
9
-
10
-
11
-
12
-
13
-
14
-
15
-
16
-
17
-
18
-
19
-
20
-
21
-
22
-
23
-
24
-
25
-
26
-
27
-
28
-
29
-
30
-
31
-
 32
32 -
 33
33 -
 34
34 -
 35
35 -
 36
36 -
 37
37 -
 38
38 -
 39
39 -
 40
40 -
 41
41 -
 42
42 -
 43
43 -
 44
44 -
 45
45 -
 46
46 -
 47
47 -
 48
48 -
 49
49 -
 50
50 -
 51
51 -
 52
52 -
53
-
54
-
55
-
56
-
57
-
58
-
59
-
60
-
61
-
62
-
63
-
64
-
65
-
66
-
67
-
68
-
69
-
70
-
71
-
72
-
73
-
74
-
75
-
76
-
77
-
78
-
79
-
80
-
81
-
82
-
83
-
84
-
85
-
86
-
87
-
88
-
89
-
90
-
91
-
92
-
93
-
94
-
95
-
96
-
97
-
98
-
99
-
100
-
101
-
102
-
103
-
104
-
105
-
106
-
107
-
108
-
109
-
110
-
111
-
112
-
113
-
114
-
115
-
116
-
117
-
118
-
119
-
120
-
121
-
122
-
123
-
124
-
125
-
126
-
127
-
128
-
129
-
130
-
131
-
132
-
133
-
134
-
135
-
136
-
137
-
138
-
139
-
140
-
141
-
142
-
143
-
144
-
145
-
146
-
147
-
148
-
149
-
150
-
151
-
152
-
153
-
154
-
155
-
156
-
157
-
158
-
159
-
160
-
161
-
162
-
163
-
164
-
165
-
166
-
167
-
168
-
169
-
170
-
171
-
172
-
173
-
174
-
175
-
176
-
177
-
178
-
179
-
180
-
181
-
182
-
183
-
184
-
185
-
186
-
187
-
188
-
189
-
190
-
191
-
192
-
193
-
194
-
195
-
196
-
197
-
198
-
199
-
200
-
201
-
202
-
203
-
204
-
205
-
206
-
207
-
208
-
209
-
210
-
211
-
212
-
213
-
214
-
215
-
216
-
217
-
218
-
219
-
220
-
221
-
222
-
223
-
224
 |
 |

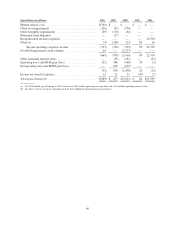
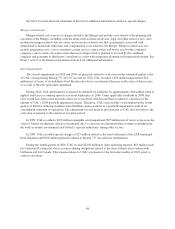
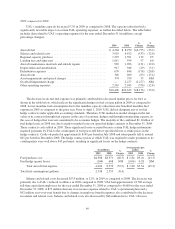
Special Items (in millions) 2010 2009 2008 2007 2006
Merger-related costs .................................. $(564) $ — $ — $ — $ —
Other asset impairments ............................... (136) (93) (250) — —
Other intangible impairments ........................... (29) (150) (64) — —
Municipal bond litigation .............................. — (27) — — —
Reorganization income (expense) ........................ — — — — 22,934
Other (a) ............................................ (4) (104) (25) 89 36
Special operating (expense) income .................. (733) (374) (339) 89 22,970
Goodwill impairment credit (charge) ..................... 64 — (2,277) — —
(669) (374) (2,616) 89 22,970
Other operating expense items .......................... — (35) (191) — (22)
Operating non-cash MTM gain (loss) ..................... (32) 586 (568) 20 (2)
Nonoperating non-cash MTM gain (loss) .................. — 279 (279) — —
(32) 830 (1,038) 20 (24)
Income tax benefit (expense) ............................ 12 21 31 (47) (7)
Total special items (b) ................................. $(689) $ 477 $(3,623) $ 62 $22,939
(a) The $89 million special charge in 2007 consists of a $45 million operating revenue item and a $44 million operating expense item.
(b) See Note 21 to the financial statements in Item 8 for additional information on special items.
40