United Airlines 2010 Annual Report Download - page 49
Download and view the complete annual report
Please find page 49 of the 2010 United Airlines annual report below. You can navigate through the pages in the report by either clicking on the pages listed below, or by using the keyword search tool below to find specific information within the annual report.-
 1
1 -
2
-
3
-
4
-
5
-
6
-
7
-
8
-
9
-
10
-
11
-
12
-
13
-
14
-
15
-
16
-
17
-
18
-
19
-
20
-
21
-
22
-
23
-
24
-
25
-
26
-
27
-
28
-
29
-
30
-
31
-
32
-
33
-
34
-
35
-
36
-
37
-
38
-
 39
39 -
 40
40 -
 41
41 -
 42
42 -
 43
43 -
 44
44 -
 45
45 -
 46
46 -
 47
47 -
 48
48 -
 49
49 -
 50
50 -
 51
51 -
 52
52 -
 53
53 -
 54
54 -
 55
55 -
 56
56 -
 57
57 -
 58
58 -
 59
59 -
60
-
61
-
62
-
63
-
64
-
65
-
66
-
67
-
68
-
69
-
70
-
71
-
72
-
73
-
74
-
75
-
76
-
77
-
78
-
79
-
80
-
81
-
82
-
83
-
84
-
85
-
86
-
87
-
88
-
89
-
90
-
91
-
92
-
93
-
94
-
95
-
96
-
97
-
98
-
99
-
100
-
101
-
102
-
103
-
104
-
105
-
106
-
107
-
108
-
109
-
110
-
111
-
112
-
113
-
114
-
115
-
116
-
117
-
118
-
119
-
120
-
121
-
122
-
123
-
124
-
125
-
126
-
127
-
128
-
129
-
130
-
131
-
132
-
133
-
134
-
135
-
136
-
137
-
138
-
139
-
140
-
141
-
142
-
143
-
144
-
145
-
146
-
147
-
148
-
149
-
150
-
151
-
152
-
153
-
154
-
155
-
156
-
157
-
158
-
159
-
160
-
161
-
162
-
163
-
164
-
165
-
166
-
167
-
168
-
169
-
170
-
171
-
172
-
173
-
174
-
175
-
176
-
177
-
178
-
179
-
180
-
181
-
182
-
183
-
184
-
185
-
186
-
187
-
188
-
189
-
190
-
191
-
192
-
193
-
194
-
195
-
196
-
197
-
198
-
199
-
200
-
201
-
202
-
203
-
204
-
205
-
206
-
207
-
208
-
209
-
210
-
211
-
212
-
213
-
214
-
215
-
216
-
217
-
218
-
219
-
220
-
221
-
222
-
223
-
224
 |
 |

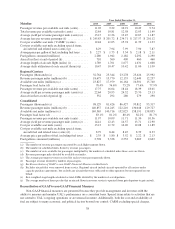
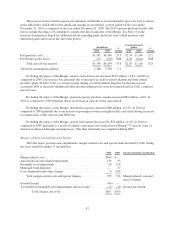
The increase in aircraft fuel expense was primarily attributable to increased market prices for fuel, as shown
in the table below which reflects the significant changes in aircraft fuel cost per gallon for the year ended
December 31, 2010 as compared to the year ended December 31, 2009. The 2010 amounts presented in the table
below exclude the impact of Continental’s results after the closing date of the Merger. See Note 13 to the
financial statements in Item 8 for additional details regarding gains and losses from settled positions and
unrealized gains and losses at the end of the period.
(In millions) %
Change
Average price per
gallon %
Change2010 2009 2010 2009
Fuel purchase cost ................................ $5,581 $4,308 29.5 $2.34 $ 1.84 27.2
Fuel hedge (gains) losses .......................... 119 (104) NM 0.05 (0.04) NM
Total aircraft fuel expense ..................... $5,700 $4,204 35.6 $2.39 $ 1.80 32.8
Total fuel consumption (gallons) .................... 2,388 2,338 2.1
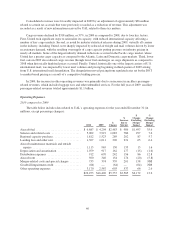
Excluding the impact of the Merger, salaries and related costs increased $297 million, or 8%, in 2010 as
compared to 2009. The increase was primarily due to increased accruals for profit sharing and other annual
incentive plans. In 2010, UAL’s accrual for profit sharing was $166 million. Expense for the plan was not
accrued in 2009 as the profit sharing and other incentive plan payouts were not earned based on UAL’s adjusted
pre-tax losses.
Excluding the impact of the Merger, regional capacity purchase expense increased $87 million, or 6%, in
2010 as compared to 2009 primarily due to an increase in capacity in the same period.
Excluding the impact of the Merger, distribution expenses increased $86 million, or 13%, in 2010 as
compared to 2009 primarily due to an increase in passenger revenue on higher traffic and yields driving increases
in commissions, credit card fees and GDS fees.
Excluding the impact of the Merger, aircraft rent expense decreased by $20 million, or 6%, in 2010 as
compared to 2009, primarily as a result of United’s retirement of its entire fleet of Boeing 737 aircraft, some of
which were financed through operating leases. This fleet retirement was completed during 2009.
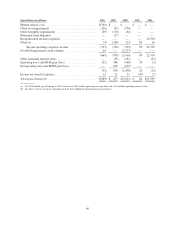
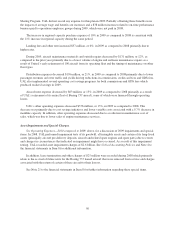
Merger-related Costs and Special Charges.
The table below presents asset impairments, merger-related costs and special items incurred by UAL during
the years ended December 31 (in millions):
2010 2009 Income statement classification
Merger-related costs ....................................... $564 $—
Aircraft and aircraft related impairments ....................... 136 93
Intangible asset impairments ................................ 29 150
Municipal bond litigation ................................... — 27
Lease termination and other charges .......................... 4 104
Total merger-related costs and special charges .............. 733 374 Merger-related costs and
special charges
Goodwill credit ........................................... (64) —
Tax benefit on intangible asset impairments and asset sales ........ (12) (21) Income tax benefit
Total charges, net of tax ............................ $657 $353
47