United Airlines 2010 Annual Report Download - page 100
Download and view the complete annual report
Please find page 100 of the 2010 United Airlines annual report below. You can navigate through the pages in the report by either clicking on the pages listed below, or by using the keyword search tool below to find specific information within the annual report.-
 1
1 -
2
-
3
-
4
-
5
-
6
-
7
-
8
-
9
-
10
-
11
-
12
-
13
-
14
-
15
-
16
-
17
-
18
-
19
-
20
-
21
-
22
-
23
-
24
-
25
-
26
-
27
-
28
-
29
-
30
-
31
-
32
-
33
-
34
-
35
-
36
-
37
-
38
-
39
-
40
-
41
-
42
-
43
-
44
-
45
-
46
-
47
-
48
-
49
-
50
-
51
-
52
-
53
-
54
-
55
-
56
-
57
-
58
-
59
-
60
-
61
-
62
-
63
-
64
-
65
-
66
-
67
-
68
-
69
-
70
-
71
-
72
-
73
-
74
-
75
-
76
-
77
-
78
-
79
-
80
-
81
-
82
-
83
-
84
-
85
-
86
-
87
-
88
-
89
-
 90
90 -
 91
91 -
 92
92 -
 93
93 -
 94
94 -
 95
95 -
 96
96 -
 97
97 -
 98
98 -
 99
99 -
 100
100 -
 101
101 -
 102
102 -
 103
103 -
 104
104 -
 105
105 -
 106
106 -
 107
107 -
 108
108 -
 109
109 -
 110
110 -
111
-
112
-
113
-
114
-
115
-
116
-
117
-
118
-
119
-
120
-
121
-
122
-
123
-
124
-
125
-
126
-
127
-
128
-
129
-
130
-
131
-
132
-
133
-
134
-
135
-
136
-
137
-
138
-
139
-
140
-
141
-
142
-
143
-
144
-
145
-
146
-
147
-
148
-
149
-
150
-
151
-
152
-
153
-
154
-
155
-
156
-
157
-
158
-
159
-
160
-
161
-
162
-
163
-
164
-
165
-
166
-
167
-
168
-
169
-
170
-
171
-
172
-
173
-
174
-
175
-
176
-
177
-
178
-
179
-
180
-
181
-
182
-
183
-
184
-
185
-
186
-
187
-
188
-
189
-
190
-
191
-
192
-
193
-
194
-
195
-
196
-
197
-
198
-
199
-
200
-
201
-
202
-
203
-
204
-
205
-
206
-
207
-
208
-
209
-
210
-
211
-
212
-
213
-
214
-
215
-
216
-
217
-
218
-
219
-
220
-
221
-
222
-
223
-
224
 |
 |

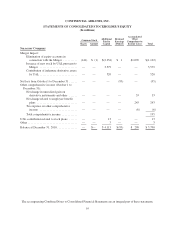
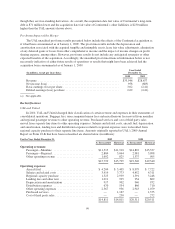
Allocation of Consideration Transferred
The Merger was accounted for using the acquisition method of accounting under applicable accounting
principles. The acquisition method of accounting requires, among other things, that assets acquired and liabilities
assumed be recognized on the balance sheet at their fair values as of the acquisition date. The table below
represents the allocation of the total consideration to Continental’s tangible and intangible assets and liabilities as
of October 1, 2010 based upon management’s estimate of their respective fair values. The goodwill resulting
from the Merger is primarily due to expected synergies to be gained from an enhanced route network and other
operating efficiencies. These acquisition accounting adjustments have also been pushed down to Continental for
its separate-entity financial reporting. None of the goodwill is deductible for tax purposes.
(In millions)
Cash and cash equivalents ............................................................ $3,698
Other current assets .................................................................. 1,811
Property and equipment .............................................................. 7,480
Goodwill .......................................................................... 4,523
Identified intangibles ................................................................ 2,594
Other noncurrent assets ............................................................... 237
Long-term debt and capital leases, including current portion ................................. (7,000)
Advance ticket sales ................................................................. (1,724)
Frequent flyer liability ............................................................... (1,978)
Pension and postretirement benefits ..................................................... (1,872)
Deferred income taxes ............................................................... (735)
Other liabilities ..................................................................... (3,298)
Total purchase price ............................................................. $3,736
The fair values of the assets acquired and liabilities assumed were determined using the market, income and
cost approaches. The fair value measurements were primarily based on significant inputs that are not observable
in the market other than for derivative financial instruments and certain long-term debt assumed in the Merger.
The market approach, which indicates value for a subject asset based on available market pricing for comparable
assets, was utilized to estimate the fair value of Continental’s aircraft and operating leases. The market approach
used by the Company included prices and other relevant information generated by market transactions involving
comparable assets, as well as pricing guides and other sources. The Company considered the current market for
the aircraft, the maintenance condition of the aircraft and the expected proceeds from the sale of the assets,
among other factors. The Company also utilized the market approach to value certain intangible assets such as
airport take-off and landing slots when sufficient market information was available. The income approach was
primarily used to value intangible assets, including the frequent flyer database, international route authorities,
alliances, the Continental logo and tradename, and certain airport take-off and landing slots. The income
approach indicates value for a subject asset based on the present value of cash flows projected to be generated by
the asset. Projected cash flows are discounted at a required market rate of return that reflects the relative risk of
achieving the cash flows and the time value of money. The cost approach, which estimates value by determining
the current cost of replacing an asset with another of equivalent economic utility, was used, as appropriate, for
certain assets for which the market and income approaches could not be applied due to the nature of the asset.
The cost to replace a given asset reflects the estimated reproduction or replacement cost for the asset, less an
allowance for loss in value due to depreciation. The fair value of Continental’s OnePass frequent flyer program
liability was determined based on the weighted average equivalent ticket value of outstanding miles which were
expected to be redeemed at October 1, 2010. The weighted average equivalent ticket value contemplates differing
classes of service, domestic and international itineraries and the carrier providing the award travel.
As more fully discussed in Note 14, and only for purposes of the Continental separate-entity reporting, the
embedded conversion options in Continental’s convertible debt are required to be separated and accounted for as
98