United Airlines 2010 Annual Report Download - page 55
Download and view the complete annual report
Please find page 55 of the 2010 United Airlines annual report below. You can navigate through the pages in the report by either clicking on the pages listed below, or by using the keyword search tool below to find specific information within the annual report.-
 1
1 -
2
-
3
-
4
-
5
-
6
-
7
-
8
-
9
-
10
-
11
-
12
-
13
-
14
-
15
-
16
-
17
-
18
-
19
-
20
-
21
-
22
-
23
-
24
-
25
-
26
-
27
-
28
-
29
-
30
-
31
-
32
-
33
-
34
-
35
-
36
-
37
-
38
-
39
-
40
-
41
-
42
-
43
-
44
-
 45
45 -
 46
46 -
 47
47 -
 48
48 -
 49
49 -
 50
50 -
 51
51 -
 52
52 -
 53
53 -
 54
54 -
 55
55 -
 56
56 -
 57
57 -
 58
58 -
 59
59 -
 60
60 -
 61
61 -
 62
62 -
 63
63 -
 64
64 -
 65
65 -
66
-
67
-
68
-
69
-
70
-
71
-
72
-
73
-
74
-
75
-
76
-
77
-
78
-
79
-
80
-
81
-
82
-
83
-
84
-
85
-
86
-
87
-
88
-
89
-
90
-
91
-
92
-
93
-
94
-
95
-
96
-
97
-
98
-
99
-
100
-
101
-
102
-
103
-
104
-
105
-
106
-
107
-
108
-
109
-
110
-
111
-
112
-
113
-
114
-
115
-
116
-
117
-
118
-
119
-
120
-
121
-
122
-
123
-
124
-
125
-
126
-
127
-
128
-
129
-
130
-
131
-
132
-
133
-
134
-
135
-
136
-
137
-
138
-
139
-
140
-
141
-
142
-
143
-
144
-
145
-
146
-
147
-
148
-
149
-
150
-
151
-
152
-
153
-
154
-
155
-
156
-
157
-
158
-
159
-
160
-
161
-
162
-
163
-
164
-
165
-
166
-
167
-
168
-
169
-
170
-
171
-
172
-
173
-
174
-
175
-
176
-
177
-
178
-
179
-
180
-
181
-
182
-
183
-
184
-
185
-
186
-
187
-
188
-
189
-
190
-
191
-
192
-
193
-
194
-
195
-
196
-
197
-
198
-
199
-
200
-
201
-
202
-
203
-
204
-
205
-
206
-
207
-
208
-
209
-
210
-
211
-
212
-
213
-
214
-
215
-
216
-
217
-
218
-
219
-
220
-
221
-
222
-
223
-
224
 |
 |
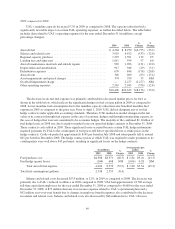
United had a net income of $399 million in 2010 as compared to a net loss of $628 million in 2009.
Excluding the impact of the Merger on UAL’s results of operations, United’s results of operations were
consistent with the UAL results discussed above. Prior to the Merger, United was UAL’s only significant
operating subsidiary. As compared to 2009, United’s consolidated revenue increased $3.3 billion, or 20%, to
$19.7 billion for the year ended December 31, 2010. This increase was primarily due to improved economic
conditions in 2010 which drove higher fares. As discussed above, in 2010, United increased consolidated
capacity only by approximately 1% due to the weak economic conditions in 2009 and 2008. United’s increase in
consolidated passenger volume was consistent with this increase in capacity.
United’s operating expenses increased approximately $2.2 billion in 2010 as compared to 2009, which was
primarily due to the following:
• An increase of approximately $1.5 billion in aircraft fuel expense, which was primarily driven by
increased market prices for aircraft fuel, as highlighted in the fuel table in Operating Expenses—2010
compared to 2009, above;
• An increase of $293 million in salaries and related costs, which was primarily due to increased accruals
for profit sharing and other annual incentive plans. In 2010, United’s profit sharing expense was $165
million. Expense for the plan was not accrued in 2009 as the profit sharing and other incentive plan
payout expenses were not earned based on UAL’s adjusted pre-tax losses;
• An $86 million, or 13%, increase in distribution expenses due to increased passenger volumes and
higher ticket fares;
• A $158 million increase in merger-related costs and special charges, primarily due to $363 million of
costs associated with the Merger and the integration of United and Continental, as discussed above. In
2009, United incurred significant special charges associated with its fleet reduction plan. See Note 21
to the financial statements in Item 8 for additional details regarding merger-related costs and special
charges; and
• Other operating expenses included a $65 million payment due to the revenue sharing obligations
related to the trans-Atlantic joint venture with Lufthansa and Air Canada.
United’s nonoperating expense increased $123 million, or 24%, in 2010 as compared to 2009, which was
primarily due to the increased cost of debt financing as a result of distressed capital markets during 2008 and
2009. United’s interest expense is consistent with UAL’s interest expense, excluding the Merger impact
discussed above, except for approximately $21 million of interest expense in 2010 from UAL’s $345 million of
6% Senior Convertible Notes due 2029 that were not issued by United.
53