United Airlines 2010 Annual Report Download - page 40
Download and view the complete annual report
Please find page 40 of the 2010 United Airlines annual report below. You can navigate through the pages in the report by either clicking on the pages listed below, or by using the keyword search tool below to find specific information within the annual report.-
 1
1 -
2
-
3
-
4
-
5
-
6
-
7
-
8
-
9
-
10
-
11
-
12
-
13
-
14
-
15
-
16
-
17
-
18
-
19
-
20
-
21
-
22
-
23
-
24
-
25
-
26
-
27
-
28
-
29
-
 30
30 -
 31
31 -
 32
32 -
 33
33 -
 34
34 -
 35
35 -
 36
36 -
 37
37 -
 38
38 -
 39
39 -
 40
40 -
 41
41 -
 42
42 -
 43
43 -
 44
44 -
 45
45 -
 46
46 -
 47
47 -
 48
48 -
 49
49 -
 50
50 -
51
-
52
-
53
-
54
-
55
-
56
-
57
-
58
-
59
-
60
-
61
-
62
-
63
-
64
-
65
-
66
-
67
-
68
-
69
-
70
-
71
-
72
-
73
-
74
-
75
-
76
-
77
-
78
-
79
-
80
-
81
-
82
-
83
-
84
-
85
-
86
-
87
-
88
-
89
-
90
-
91
-
92
-
93
-
94
-
95
-
96
-
97
-
98
-
99
-
100
-
101
-
102
-
103
-
104
-
105
-
106
-
107
-
108
-
109
-
110
-
111
-
112
-
113
-
114
-
115
-
116
-
117
-
118
-
119
-
120
-
121
-
122
-
123
-
124
-
125
-
126
-
127
-
128
-
129
-
130
-
131
-
132
-
133
-
134
-
135
-
136
-
137
-
138
-
139
-
140
-
141
-
142
-
143
-
144
-
145
-
146
-
147
-
148
-
149
-
150
-
151
-
152
-
153
-
154
-
155
-
156
-
157
-
158
-
159
-
160
-
161
-
162
-
163
-
164
-
165
-
166
-
167
-
168
-
169
-
170
-
171
-
172
-
173
-
174
-
175
-
176
-
177
-
178
-
179
-
180
-
181
-
182
-
183
-
184
-
185
-
186
-
187
-
188
-
189
-
190
-
191
-
192
-
193
-
194
-
195
-
196
-
197
-
198
-
199
-
200
-
201
-
202
-
203
-
204
-
205
-
206
-
207
-
208
-
209
-
210
-
211
-
212
-
213
-
214
-
215
-
216
-
217
-
218
-
219
-
220
-
221
-
222
-
223
-
224
 |
 |

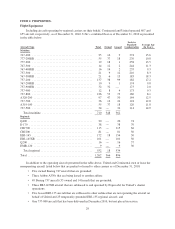
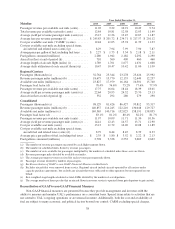
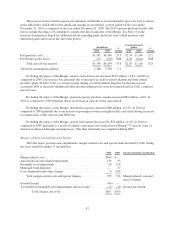
Year Ended December 31,
Mainline 2010 2009 2008 2007 2006
Passenger revenue per available seat mile (cents) ...... 11.03 9.22 10.91 10.49 9.74
Total revenue per available seat mile (cents) .......... 12.84 10.81 12.58 12.03 11.49
Average yield per revenue passenger mile (cents) (e) . . . 13.15 11.26 13.47 12.67 11.87
Average fare per revenue passenger (f) .............. $ 245.83 $ 201.72 $ 234.71 $ 217.57 $ 201.12
Cost per available seat mile (“CASM”) (cents) ........ 12.44 11.05 15.74 11.39 11.23
Cost per available seat mile excluding special items,
aircraft fuel and related taxes (cents) (g) ........... 8.29 7.94 7.99 7.90 7.87
Averagepricepergallonoffuel,includingfueltaxes ..... $ 2.27 $ 1.75 $ 3.54 $ 2.18 $ 2.11
Fuel gallons consumed (millions) .................. 2,280 1,942 2,182 2,292 2,290
Aircraft in fleet at end of period (h) ................. 710 360 409 460 460
Average length of aircraft flight (miles) (i) ........... 1,789 1,701 1,677 1,631 1,608
Average daily utilization of each aircraft (hours) (j) .... 10.47 10.47 10.42 11.00 11.09
Regional Carriers
Passengers (thousands) (a) ........................ 32,764 25,344 23,278 25,426 25,992
Revenue passenger miles (millions) (b) .............. 18,675 13,770 12,155 12,649 12,257
Available seat miles (millions) (c) .................. 23,827 17,979 16,164 16,301 15,740
Passenger load factor (d) ......................... 78.4% 76.6% 75.2% 77.6% 77.9%
Passenger revenue per available seat mile (cents) ...... 17.75 16.04 18.44 18.39 18.01
Average yield per revenue passenger mile (cents) (e) . . . 22.64 20.95 24.52 23.70 23.13
Aircraft in fleet at end of period (g) ................. 552 292 280 279 290
Consolidated
Passengers (thousands) (a) ........................ 98,129 81,426 86,427 93,812 95,317
Revenue passenger miles (millions) (b) .............. 140,857 114,245 122,216 130,048 129,727
Available seat miles (millions) (c) .................. 169,565 140,716 152,025 158,191 158,835
Passenger load factor (d) ......................... 83.1% 81.2% 80.4% 82.2% 81.7%
Passenger revenue per available seat mile (cents) ...... 11.97 10.09 11.71 11.30 10.56
Average yield per revenue passenger mile (cents) (e) . . . 14.41 12.43 14.57 13.71 12.90
Cost per available seat mile (cents) ................. 13.12 11.72 16.20 12.08 11.89
Cost per available seat mile excluding special items,
aircraft fuel and related taxes (cents) (f) ........... 8.79 8.44 8.45 8.39 8.33
Average price per gallon of fuel, including fuel taxes . . . $ 2.35 $ 1.80 $ 3.52 $ 2.22 $ 2.13
Fuel gallons consumed (millions) .................. 2,798 2,338 2,553 2,669 2,663
(a) The number of revenue passengers measured by each flight segment flown.
(b) The number of scheduled miles flown by revenue passengers.
(c) The number of seats available for passengers multiplied by the number of scheduled miles those seats are flown.
(d) Revenue passenger miles divided by available seat miles.
(e) The average passenger revenue received for each revenue passenger mile flown.
(f) Passenger revenue divided by number of passengers.
(g) See Reconciliation of GAAP to non-GAAP Financial Measures in this Item 6.
(h) Excludes aircraft that were removed from service. Regional aircraft include aircraft operated by all carriers under
capacity purchase agreements, but exclude any aircraft that were subleased to other operators but not operated on our
behalf.
(i) Seat-weighted stage length calculated as total ASMs divided by the number of seat departures.
(j) The average number of hours per day that an aircraft flown in revenue service is operated (from gate departure to gate arrival).
Reconciliation of GAAP to non-GAAP Financial Measures
Non-GAAP financial measures are presented because they provide management and investors with the
ability to measure and monitor UAL’s performance on a consistent basis. Special items relate to activities that are
not central to UAL’s ongoing operations or are unusual in nature. Additionally, both the cost and availability of
fuel are subject to many economic and political factors beyond our control. CASM excluding special charges,
38