United Airlines 2010 Annual Report Download - page 58
Download and view the complete annual report
Please find page 58 of the 2010 United Airlines annual report below. You can navigate through the pages in the report by either clicking on the pages listed below, or by using the keyword search tool below to find specific information within the annual report.-
 1
1 -
2
-
3
-
4
-
5
-
6
-
7
-
8
-
9
-
10
-
11
-
12
-
13
-
14
-
15
-
16
-
17
-
18
-
19
-
20
-
21
-
22
-
23
-
24
-
25
-
26
-
27
-
28
-
29
-
30
-
31
-
32
-
33
-
34
-
35
-
36
-
37
-
38
-
39
-
40
-
41
-
42
-
43
-
44
-
45
-
46
-
47
-
 48
48 -
 49
49 -
 50
50 -
 51
51 -
 52
52 -
 53
53 -
 54
54 -
 55
55 -
 56
56 -
 57
57 -
 58
58 -
 59
59 -
 60
60 -
 61
61 -
 62
62 -
 63
63 -
 64
64 -
 65
65 -
 66
66 -
 67
67 -
 68
68 -
69
-
70
-
71
-
72
-
73
-
74
-
75
-
76
-
77
-
78
-
79
-
80
-
81
-
82
-
83
-
84
-
85
-
86
-
87
-
88
-
89
-
90
-
91
-
92
-
93
-
94
-
95
-
96
-
97
-
98
-
99
-
100
-
101
-
102
-
103
-
104
-
105
-
106
-
107
-
108
-
109
-
110
-
111
-
112
-
113
-
114
-
115
-
116
-
117
-
118
-
119
-
120
-
121
-
122
-
123
-
124
-
125
-
126
-
127
-
128
-
129
-
130
-
131
-
132
-
133
-
134
-
135
-
136
-
137
-
138
-
139
-
140
-
141
-
142
-
143
-
144
-
145
-
146
-
147
-
148
-
149
-
150
-
151
-
152
-
153
-
154
-
155
-
156
-
157
-
158
-
159
-
160
-
161
-
162
-
163
-
164
-
165
-
166
-
167
-
168
-
169
-
170
-
171
-
172
-
173
-
174
-
175
-
176
-
177
-
178
-
179
-
180
-
181
-
182
-
183
-
184
-
185
-
186
-
187
-
188
-
189
-
190
-
191
-
192
-
193
-
194
-
195
-
196
-
197
-
198
-
199
-
200
-
201
-
202
-
203
-
204
-
205
-
206
-
207
-
208
-
209
-
210
-
211
-
212
-
213
-
214
-
215
-
216
-
217
-
218
-
219
-
220
-
221
-
222
-
223
-
224
 |
 |
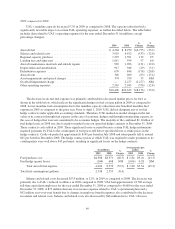
Cash Flows from Operating Activities.
2010 compared to 2009
UAL’s cash from operating activities increased by $941 million in 2010, as compared to 2009. This year-
over-year increase was primarily due to increased cash from passenger and cargo services. Higher cash operating
expenses, including fuel, distribution costs and interest expense, partially offset the benefit from increased
revenues. Net cash required for fuel increased in the 2010 period due to higher aircraft fuel prices, as shown in
the fuel expense table in Results of Operations—Operating Expenses—2010 Compared to 2009, above.
Operating cash flows in the 2009 period included the receipt of $160 million related to the future relocation of
UAL’s Chicago O’Hare cargo facility.
2009 compared to 2008
UAL’s cash from operating activities increased by $2.2 billion in 2009 as compared to 2008. This
improvement was partly due to decreased cash required for aircraft fuel purchases as consolidated fuel purchase
costs decreased by $4.1 billion in 2009 as compared to 2008. Decreases in UAL’s fuel hedge collateral
requirements also provided operating cash of approximately $955 million in 2009, as compared to a use of cash
of $965 million in 2008. In addition, UAL received $160 million during 2009 related to the future relocation of
its Chicago O’Hare cargo facility.
These operating cash flow benefits were partially offset by a decrease in operating cash flow due to
decreased revenues, which decreased by $3.9 billion in 2009. In addition, UAL did not have a significant
advance sale of miles in 2009 resulting in an unfavorable variance as compared to 2008, during which UAL
received $600 million from its advanced sale of miles and license agreement with its co-branded credit card
partner, as discussed below.
Cash Flows from Investing Activities.
2010 compared to 2009
UAL’s capital expenditures were $371 million and $317 million in 2010 and 2009, respectively. Included in
UAL’s capital expenditures are Continental’s capital expenditures in the fourth quarter of 2010. In addition to
cash capital expenditures, UAL’s asset additions include Continental’s acquisition of three Boeing 737 aircraft in
the fourth quarter of 2010. The proceeds of the EETC financing in the fourth quarter of 2010 (described below)
were directly issued to the aircraft manufacturers; therefore, these proceeds are not presented as capital
expenditures and financing proceeds in the statements of consolidated cash flows. UAL limited its spending in
both 2010 and 2009 by focusing its capital resources only on its highest-value projects.
In 2009, United received $175 million from three sale-leaseback agreements. These transactions were
accounted for as capital leases, resulting in an increase to capital lease assets and capital lease obligations during
2009.
2009 compared to 2008
The sale of $2.3 billion of short-term investments throughout 2008 generated significant investing cash
flows in 2008 as compared to 2009. As discussed below, these investments were sold as part of UAL’s shift to
invest available cash into money market funds. UAL’s capital expenditures, which included capitalized interest,
were $317 million and $475 million in 2009 and 2008, respectively. Capital expenditures decreased significantly
in the 2009 period as compared to 2008 because the Company acquired only one aircraft in 2009, as compared to
ten aircraft acquired during 2008. The 2009 and 2008 aircraft acquisitions were completed pursuant to existing
lease terms using pre-funded lease deposits, as described below in Cash Flows from Financing Activities below.
In 2009, United received $175 million from three sale-leaseback agreements, described above. The 2008
period included proceeds of $274 million from one sale-leaseback transaction. Other asset sales, including airport
slot sales, generated proceeds of $77 million and $94 million during 2009 and 2008, respectively.
56