United Airlines 2010 Annual Report Download - page 116
Download and view the complete annual report
Please find page 116 of the 2010 United Airlines annual report below. You can navigate through the pages in the report by either clicking on the pages listed below, or by using the keyword search tool below to find specific information within the annual report.-
 1
1 -
2
-
3
-
4
-
5
-
6
-
7
-
8
-
9
-
10
-
11
-
12
-
13
-
14
-
15
-
16
-
17
-
18
-
19
-
20
-
21
-
22
-
23
-
24
-
25
-
26
-
27
-
28
-
29
-
30
-
31
-
32
-
33
-
34
-
35
-
36
-
37
-
38
-
39
-
40
-
41
-
42
-
43
-
44
-
45
-
46
-
47
-
48
-
49
-
50
-
51
-
52
-
53
-
54
-
55
-
56
-
57
-
58
-
59
-
60
-
61
-
62
-
63
-
64
-
65
-
66
-
67
-
68
-
69
-
70
-
71
-
72
-
73
-
74
-
75
-
76
-
77
-
78
-
79
-
80
-
81
-
82
-
83
-
84
-
85
-
86
-
87
-
88
-
89
-
90
-
91
-
92
-
93
-
94
-
95
-
96
-
97
-
98
-
99
-
100
-
101
-
102
-
103
-
104
-
105
-
 106
106 -
 107
107 -
 108
108 -
 109
109 -
 110
110 -
 111
111 -
 112
112 -
 113
113 -
 114
114 -
 115
115 -
 116
116 -
 117
117 -
 118
118 -
 119
119 -
 120
120 -
 121
121 -
 122
122 -
 123
123 -
 124
124 -
 125
125 -
 126
126 -
127
-
128
-
129
-
130
-
131
-
132
-
133
-
134
-
135
-
136
-
137
-
138
-
139
-
140
-
141
-
142
-
143
-
144
-
145
-
146
-
147
-
148
-
149
-
150
-
151
-
152
-
153
-
154
-
155
-
156
-
157
-
158
-
159
-
160
-
161
-
162
-
163
-
164
-
165
-
166
-
167
-
168
-
169
-
170
-
171
-
172
-
173
-
174
-
175
-
176
-
177
-
178
-
179
-
180
-
181
-
182
-
183
-
184
-
185
-
186
-
187
-
188
-
189
-
190
-
191
-
192
-
193
-
194
-
195
-
196
-
197
-
198
-
199
-
200
-
201
-
202
-
203
-
204
-
205
-
206
-
207
-
208
-
209
-
210
-
211
-
212
-
213
-
214
-
215
-
216
-
217
-
218
-
219
-
220
-
221
-
222
-
223
-
224
 |
 |

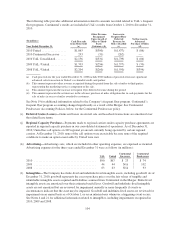
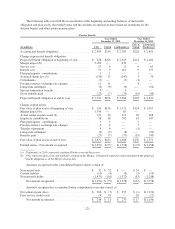
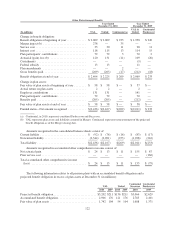
The following table provides additional information for options granted in 2009 and 2008 and Continental
Predecessor options in 2010 which were valued at the Merger closing date:
Weighted-average fair value assumptions: 2010 2009 2008
Risk-free interest rate ......................................... 0.1–1.8% 1.9 – 3.1% 1.9 – 3.6%
Dividend yield ............................................... — % — % — %
Expected market price volatility of UAL common stock .............. 75% 93% 55%
Expected life of options (years) ................................. 0.1-6.3 6.0 5.0–6.3
Weighted-average fair value .................................... $ 11.52 $ 3.72 $ 7.86
The fair value of options is determined at the grant date, and at the Merger date in the case of Continental
Predecessor options, using a Black Scholes option pricing model, which requires UAL to make several
assumptions. The risk-free interest rate is based on the U.S. treasury yield curve in effect for the expected term of
the option at the time of grant. The dividend yield on UAL’s common stock was assumed to be zero since UAL
did not have any plans to pay dividends at the time of the option grants.
The volatility assumptions were based upon historical volatilities of UAL and other comparable airlines
whose shares are traded using daily stock price returns equivalent to the contractual term of the option. In
addition, implied volatility data for both UAL and other comparable airlines, using current exchange-traded
options, was utilized.
The expected lives of the options were determined based upon either a simplified assumption that the option
will be exercised evenly from vesting to expiration or estimated using historical experience for the assumed
options. The terms of certain UAL awards do not provide for the acceleration of vesting upon retirement. In
addition, certain UAL awards and the assumed options awarded to employees that are retirement eligible either at
the grant date or within the vesting period is considered vested at the respective retirement eligibility date.
Restricted Stock Awards and Restricted Stock Units. The UAL RSUs may be settled in either cash or stock.
As a result of the Merger, UAL converted certain RSUs discussed above into fixed cash equivalents. As of
December 31, 2010, UAL, United and Continental had recorded a liability of $71 million, $7 million and $64
million, respectively, for these awards.
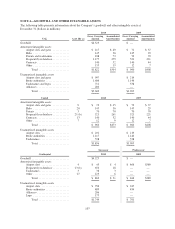
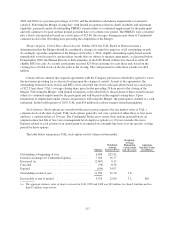
The table below summarizes UAL’s RSU and restricted stock activity for the year ended December 31,
2010 (shares in thousands):
Restricted Stock
Units
Weighted-
Average
Grant Price Restricted Stock
Weighted-
Average
Grant Price
Non-vested at beginning of year .................. 1,719 $ 4.90 811 $27.82
Assumed in Merger ............................ — — 20 23.66
Granted ...................................... 1,395 22.20 212 24.55
Modified ..................................... (449) 21.63 449 21.63
Converted to fixed cash equivalent ................ (1,496) — (164) —
Vested ...................................... (1,069) 22.41 (651) 31.47
Canceled ..................................... (49) 10.55 (6) 11.03
Non-vested at end of year ....................... 51 22.85 671 17.20
The fair value of RSUs and restricted shares vested in 2010, 2009 and 2008 was $33 million, $21 million
and $30 million, respectively. The fair value of the restricted stock awards and the restricted stock units that are
share settled was primarily based upon the share price on the date of grant. These awards are accounted for as
equity awards. The fair value of the RSUs that were cash settled were remeasured based upon the closing share
price on the day before the settlement date. These awards were accounted for as liability awards. Restricted stock
vesting and the recognition of the expense is similar to the stock option vesting described above.
114