United Airlines 2010 Annual Report Download - page 127
Download and view the complete annual report
Please find page 127 of the 2010 United Airlines annual report below. You can navigate through the pages in the report by either clicking on the pages listed below, or by using the keyword search tool below to find specific information within the annual report.-
 1
1 -
2
-
3
-
4
-
5
-
6
-
7
-
8
-
9
-
10
-
11
-
12
-
13
-
14
-
15
-
16
-
17
-
18
-
19
-
20
-
21
-
22
-
23
-
24
-
25
-
26
-
27
-
28
-
29
-
30
-
31
-
32
-
33
-
34
-
35
-
36
-
37
-
38
-
39
-
40
-
41
-
42
-
43
-
44
-
45
-
46
-
47
-
48
-
49
-
50
-
51
-
52
-
53
-
54
-
55
-
56
-
57
-
58
-
59
-
60
-
61
-
62
-
63
-
64
-
65
-
66
-
67
-
68
-
69
-
70
-
71
-
72
-
73
-
74
-
75
-
76
-
77
-
78
-
79
-
80
-
81
-
82
-
83
-
84
-
85
-
86
-
87
-
88
-
89
-
90
-
91
-
92
-
93
-
94
-
95
-
96
-
97
-
98
-
99
-
100
-
101
-
102
-
103
-
104
-
105
-
106
-
107
-
108
-
109
-
110
-
111
-
112
-
113
-
114
-
115
-
116
-
 117
117 -
 118
118 -
 119
119 -
 120
120 -
 121
121 -
 122
122 -
 123
123 -
 124
124 -
 125
125 -
 126
126 -
 127
127 -
 128
128 -
 129
129 -
 130
130 -
 131
131 -
 132
132 -
 133
133 -
 134
134 -
 135
135 -
 136
136 -
 137
137 -
138
-
139
-
140
-
141
-
142
-
143
-
144
-
145
-
146
-
147
-
148
-
149
-
150
-
151
-
152
-
153
-
154
-
155
-
156
-
157
-
158
-
159
-
160
-
161
-
162
-
163
-
164
-
165
-
166
-
167
-
168
-
169
-
170
-
171
-
172
-
173
-
174
-
175
-
176
-
177
-
178
-
179
-
180
-
181
-
182
-
183
-
184
-
185
-
186
-
187
-
188
-
189
-
190
-
191
-
192
-
193
-
194
-
195
-
196
-
197
-
198
-
199
-
200
-
201
-
202
-
203
-
204
-
205
-
206
-
207
-
208
-
209
-
210
-
211
-
212
-
213
-
214
-
215
-
216
-
217
-
218
-
219
-
220
-
221
-
222
-
223
-
224
 |
 |

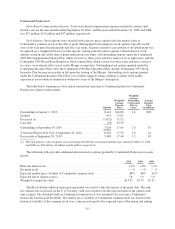
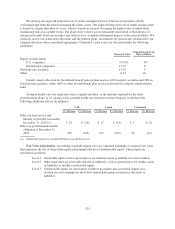
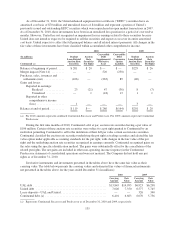
We develop our expected long-term rate of return assumption based on historical experience and by
evaluating input from the trustee managing the plans’ assets. Our expected long-term rate of return on plan assets
is based on a target allocation of assets, which is based on our goal of earning the highest rate of return while
maintaining risk at acceptable levels. The plans strive to have assets sufficiently diversified so that adverse or
unexpected results from one security class will not have an unduly detrimental impact on the entire portfolio. We
regularly review our actual asset allocation and the pension plans’ investments are periodically rebalanced to our
targeted allocation when considered appropriate. Continental’s plan assets are allocated within the following
guidelines:
Percent of Total
Expected Long-Term
Rate of Return
Equity security funds:
U.S. companies ............................................ 35-55% 8%
International companies ...................................... 15-25 8
Fixed-income securities .......................................... 15-25 5
Other ......................................................... 0-15 10
United’s target allocation for the defined benefit pension plan assets is 62% in equity securities and 38% in
fixed income securities, while 100% of other postretirement plan assets are invested in a deposit administration
fund.
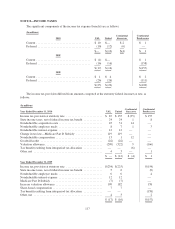
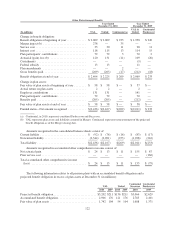
Assumed health care cost trend rates have a significant effect on the amounts reported for the other
postretirement plans. A 1% change in the assumed health care trend rate for the Company would have the
following additional effects (in millions):
UAL United Continental
1% Increase 1% Decrease 1% Increase 1% Decrease 1% Increase 1% Decrease
Effect on total service and
interest cost for the year ended
December 31, 2010 (a) ...... $ 20 $ (16) $ 17 $ (14) $ 3 $ (2)
Effect on postretirement benefit
obligation at December 31,
2010 .................... 297 (245) 272 (223) 25 (22)
(a) Continental represents combined Predecessor and Successor.
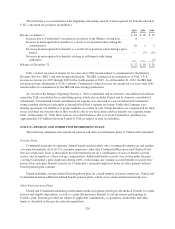
Fair Value Information. Accounting standards require us to use valuation techniques to measure fair value
that maximize the use of observable inputs and minimize the use of unobservable inputs. These inputs are
prioritized as follows:
Level 1 Observable inputs such as quoted prices for identical assets or liabilities in active markets
Level 2 Other inputs that are observable directly or indirectly, such as quoted prices for similar assets
or liabilities or market-corroborated inputs
Level 3 Unobservable inputs for which there is little or no market data and which require us to
develop our own assumptions about how market participants would price the assets or
liabilities
125